| __timestamp | China Eastern Airlines Corporation Limited | Cintas Corporation |
|---|---|---|
| Wednesday, January 1, 2014 | 4120000000 | 1302752000 |
| Thursday, January 1, 2015 | 3651000000 | 1224930000 |
| Friday, January 1, 2016 | 3133000000 | 1348122000 |
| Sunday, January 1, 2017 | 3294000000 | 1527380000 |
| Monday, January 1, 2018 | 3807000000 | 1916792000 |
| Tuesday, January 1, 2019 | 4134000000 | 1980644000 |
| Wednesday, January 1, 2020 | 1570000000 | 2071052000 |
| Friday, January 1, 2021 | 1128000000 | 1929159000 |
| Saturday, January 1, 2022 | 2933000000 | 2044876000 |
| Sunday, January 1, 2023 | 7254000000 | 2370704000 |
| Monday, January 1, 2024 | 2617783000 |
In pursuit of knowledge
In the dynamic world of corporate finance, understanding spending patterns is crucial. This analysis delves into the Selling, General, and Administrative (SG&A) expenses of two giants: Cintas Corporation and China Eastern Airlines Corporation Limited, from 2014 to 2023.
Cintas Corporation, a leader in corporate identity uniforms, has shown a consistent upward trend in SG&A expenses. From 2014 to 2023, their spending increased by approximately 80%, reflecting strategic investments in growth and operational efficiency.
In contrast, China Eastern Airlines experienced fluctuations, with a notable dip in 2020, likely due to the pandemic's impact on the aviation industry. However, by 2023, their SG&A expenses surged by over 500%, indicating a robust recovery and expansion strategy.
This comparison highlights the diverse financial strategies employed by companies in different sectors, offering valuable insights for investors and analysts.
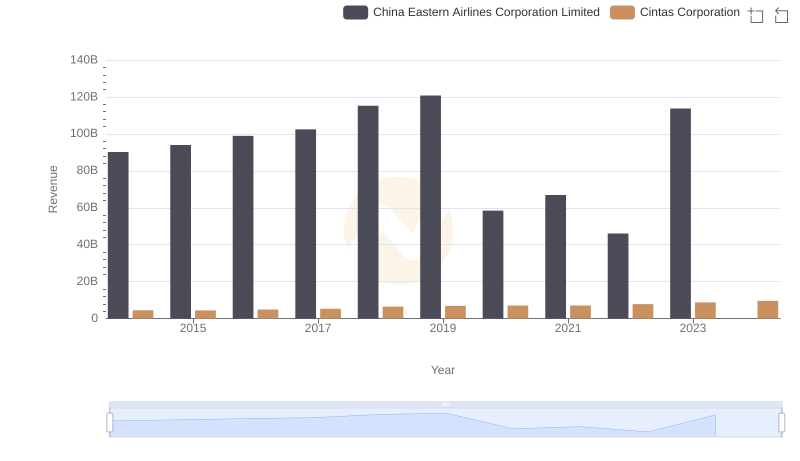
Annual Revenue Comparison: Cintas Corporation vs China Eastern Airlines Corporation Limited
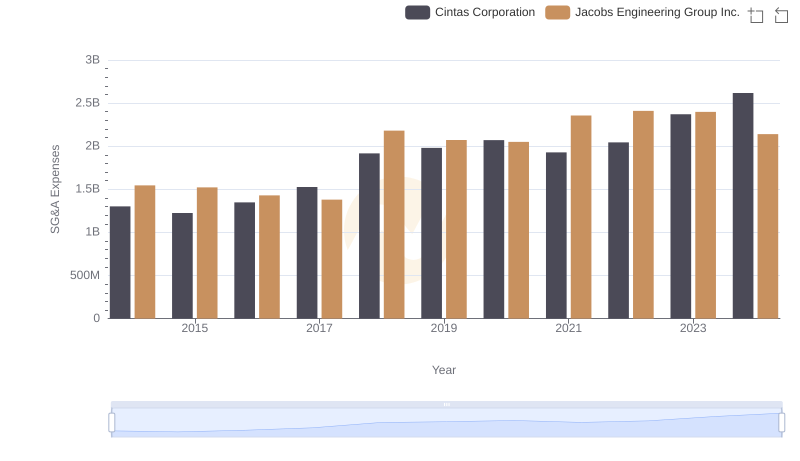
Cost Management Insights: SG&A Expenses for Cintas Corporation and Jacobs Engineering Group Inc.
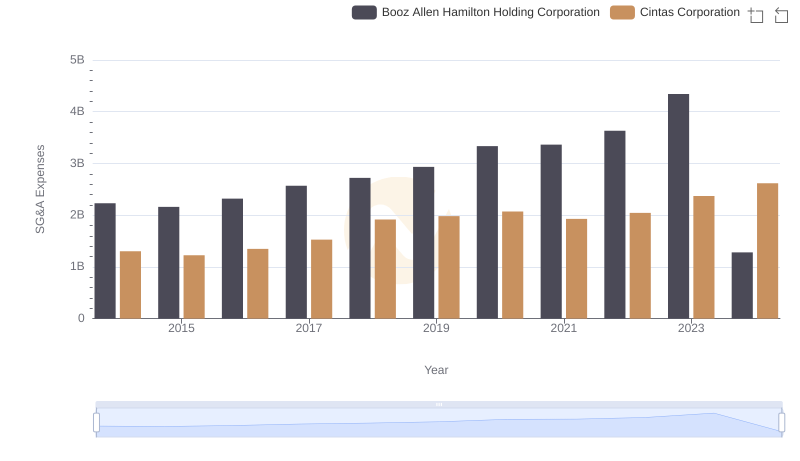
Cintas Corporation and Booz Allen Hamilton Holding Corporation: SG&A Spending Patterns Compared
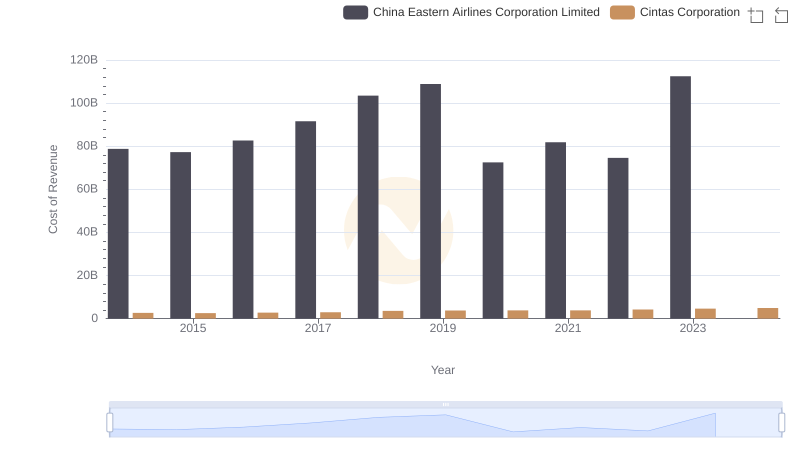
Analyzing Cost of Revenue: Cintas Corporation and China Eastern Airlines Corporation Limited
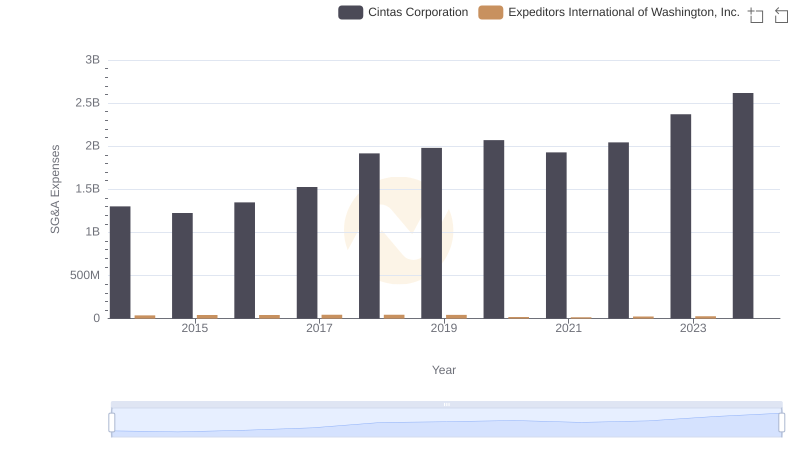
Operational Costs Compared: SG&A Analysis of Cintas Corporation and Expeditors International of Washington, Inc.
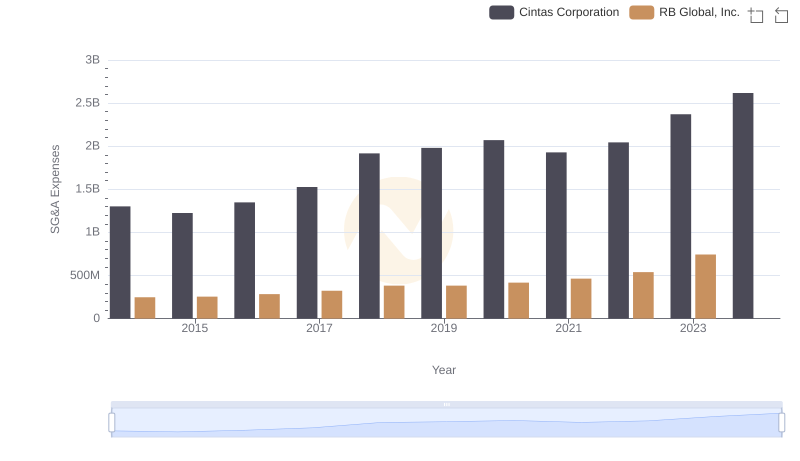
Cintas Corporation and RB Global, Inc.: SG&A Spending Patterns Compared
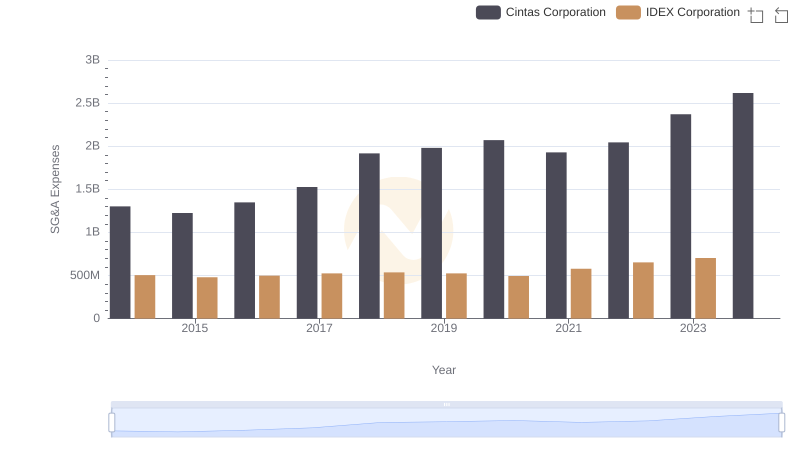
Operational Costs Compared: SG&A Analysis of Cintas Corporation and IDEX Corporation
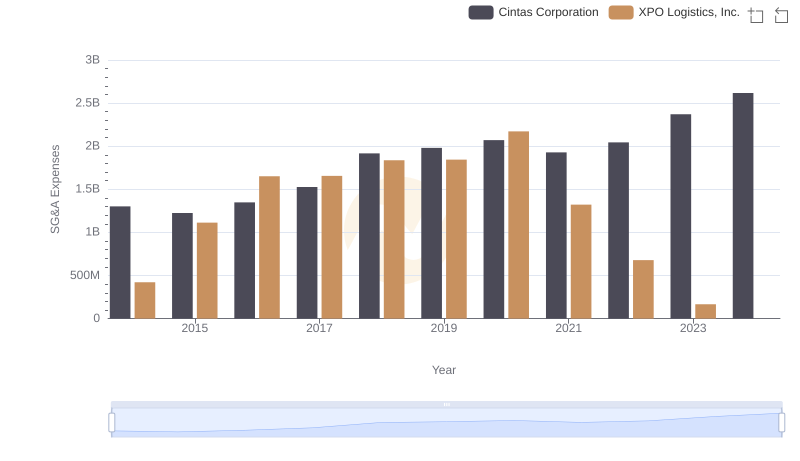
SG&A Efficiency Analysis: Comparing Cintas Corporation and XPO Logistics, Inc.
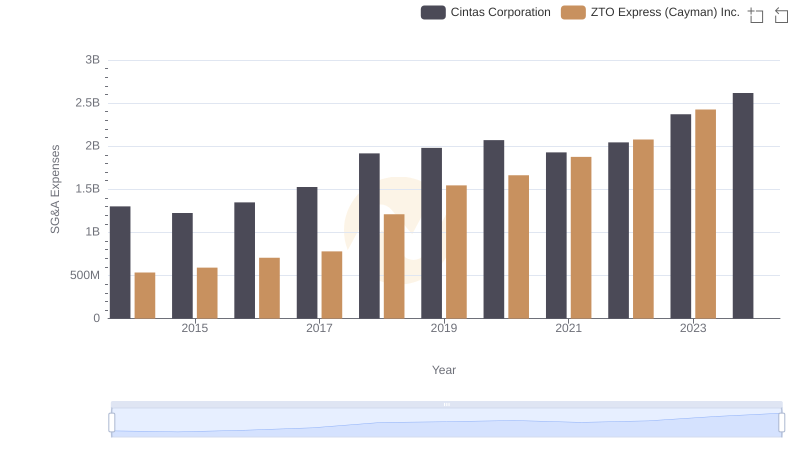
Cost Management Insights: SG&A Expenses for Cintas Corporation and ZTO Express (Cayman) Inc.