| __timestamp | Cintas Corporation | IDEX Corporation |
|---|---|---|
| Wednesday, January 1, 2014 | 2637426000 | 1198452000 |
| Thursday, January 1, 2015 | 2555549000 | 1116353000 |
| Friday, January 1, 2016 | 2775588000 | 1182276000 |
| Sunday, January 1, 2017 | 2943086000 | 1260634000 |
| Monday, January 1, 2018 | 3568109000 | 1365771000 |
| Tuesday, January 1, 2019 | 3763715000 | 1369539000 |
| Wednesday, January 1, 2020 | 3851372000 | 1324222000 |
| Friday, January 1, 2021 | 3801689000 | 1540300000 |
| Saturday, January 1, 2022 | 4222213000 | 1755000000 |
| Sunday, January 1, 2023 | 4642401000 | 1825400000 |
| Monday, January 1, 2024 | 4910199000 | 1814000000 |
Cracking the code
In the competitive landscape of corporate America, cost efficiency is a critical metric for success. This analysis delves into the cost of revenue trends for Cintas Corporation and IDEX Corporation from 2014 to 2023. Over this decade, Cintas has consistently outpaced IDEX in terms of cost of revenue, with a notable increase of approximately 86% from 2014 to 2023. In contrast, IDEX's cost of revenue grew by about 52% over the same period.
The data for 2024 is incomplete, highlighting the need for ongoing analysis to capture future trends.
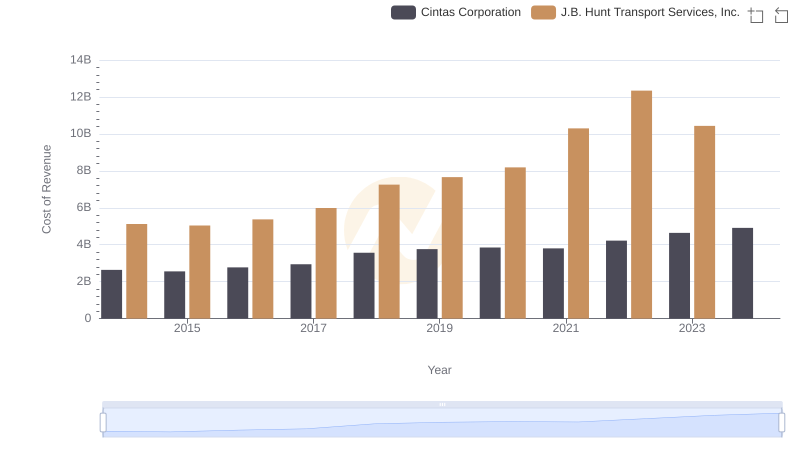
Cintas Corporation vs J.B. Hunt Transport Services, Inc.: Efficiency in Cost of Revenue Explored
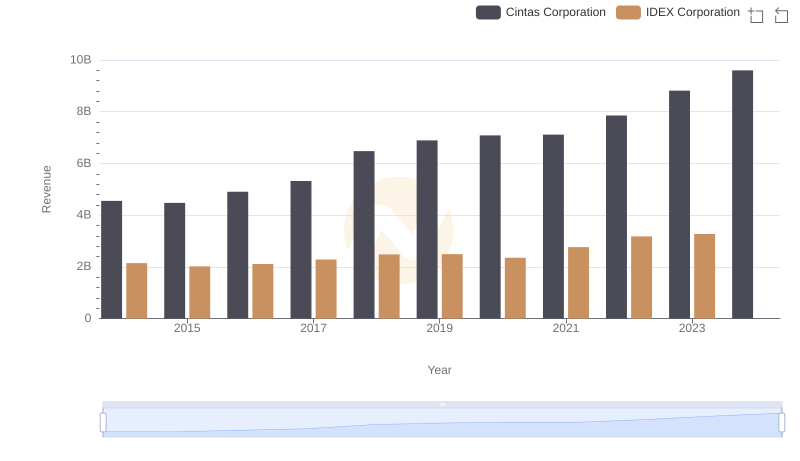
Comparing Revenue Performance: Cintas Corporation or IDEX Corporation?
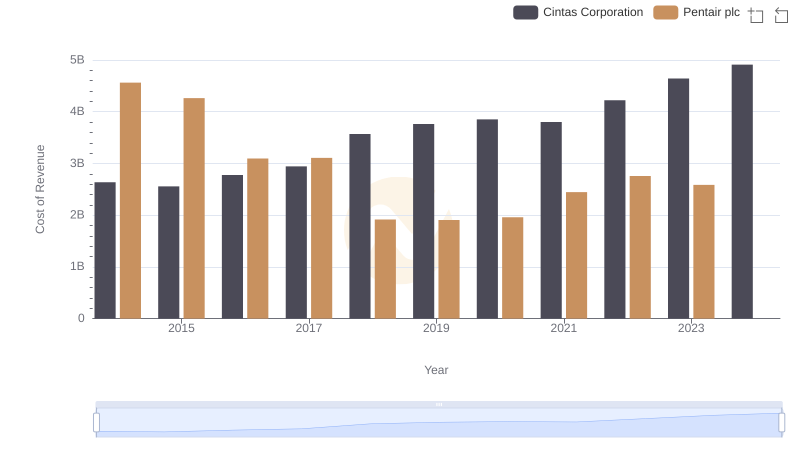
Cost of Revenue Comparison: Cintas Corporation vs Pentair plc
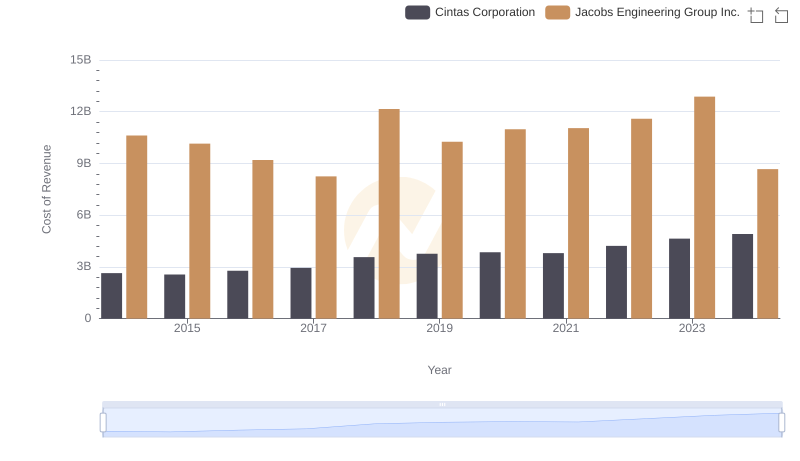
Cintas Corporation vs Jacobs Engineering Group Inc.: Efficiency in Cost of Revenue Explored
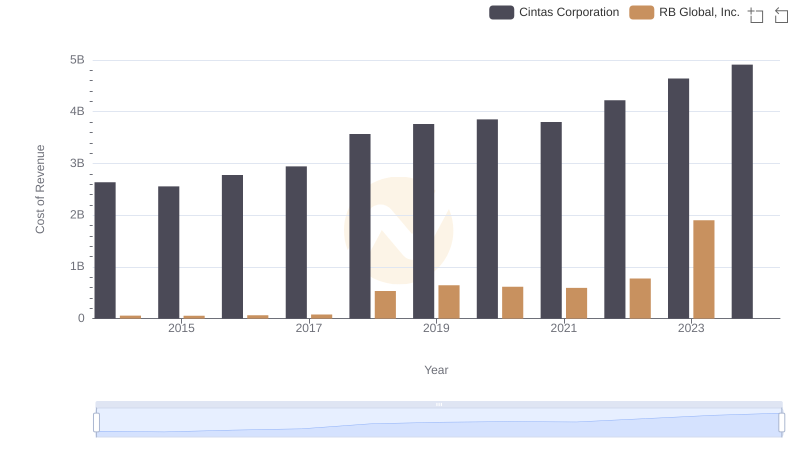
Cintas Corporation vs RB Global, Inc.: Efficiency in Cost of Revenue Explored
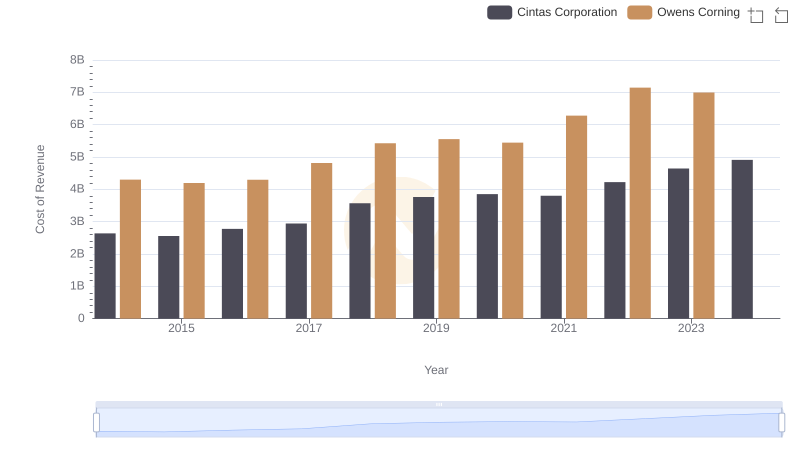
Analyzing Cost of Revenue: Cintas Corporation and Owens Corning
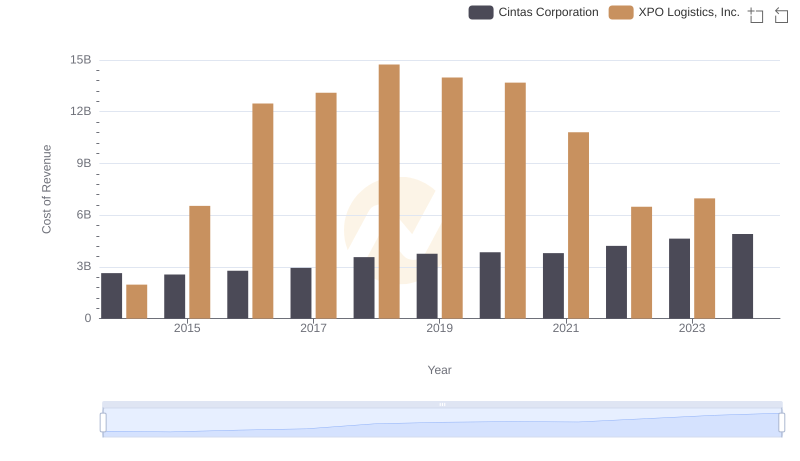
Cost of Revenue Comparison: Cintas Corporation vs XPO Logistics, Inc.
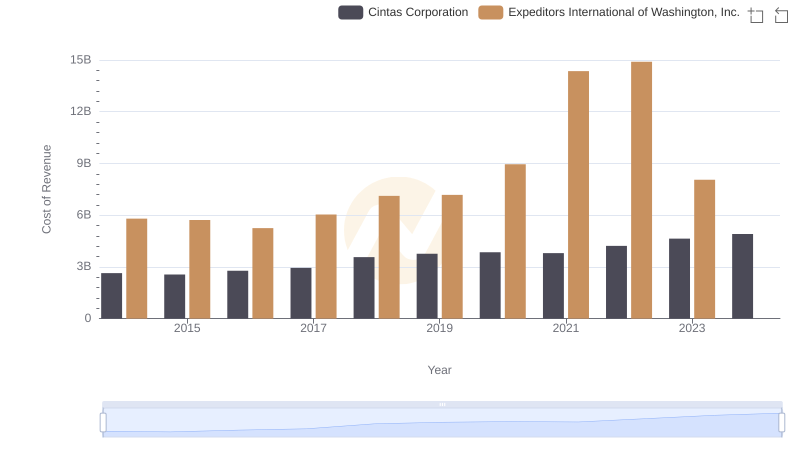
Cost Insights: Breaking Down Cintas Corporation and Expeditors International of Washington, Inc.'s Expenses
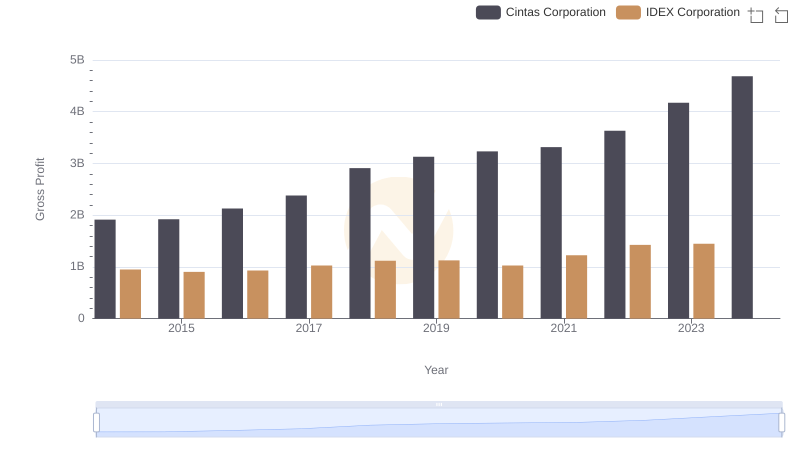
Gross Profit Trends Compared: Cintas Corporation vs IDEX Corporation
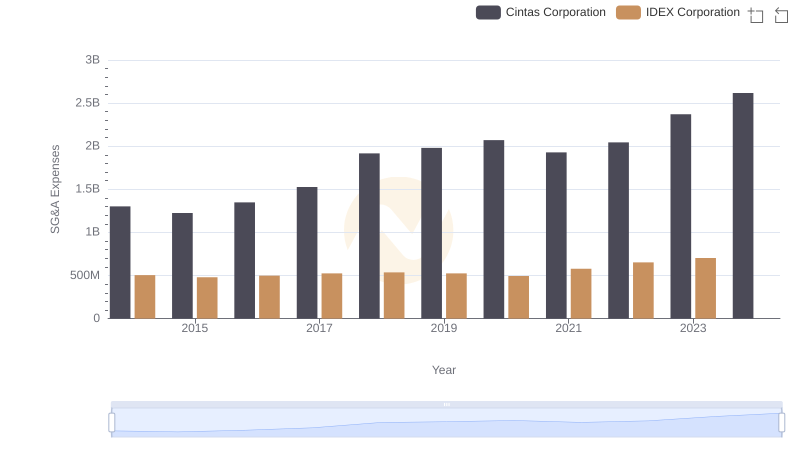
Operational Costs Compared: SG&A Analysis of Cintas Corporation and IDEX Corporation
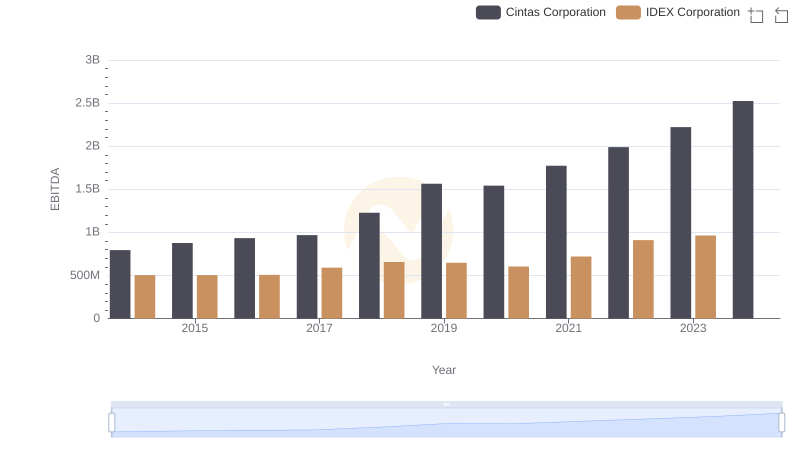
A Side-by-Side Analysis of EBITDA: Cintas Corporation and IDEX Corporation