| __timestamp | Cintas Corporation | XPO Logistics, Inc. |
|---|---|---|
| Wednesday, January 1, 2014 | 2637426000 | 1975000000 |
| Thursday, January 1, 2015 | 2555549000 | 6538400000 |
| Friday, January 1, 2016 | 2775588000 | 12480100000 |
| Sunday, January 1, 2017 | 2943086000 | 13101100000 |
| Monday, January 1, 2018 | 3568109000 | 14738000000 |
| Tuesday, January 1, 2019 | 3763715000 | 13982000000 |
| Wednesday, January 1, 2020 | 3851372000 | 13689000000 |
| Friday, January 1, 2021 | 3801689000 | 10812000000 |
| Saturday, January 1, 2022 | 4222213000 | 6491000000 |
| Sunday, January 1, 2023 | 4642401000 | 6974000000 |
| Monday, January 1, 2024 | 4910199000 | 7157000000 |
Cracking the code
In the ever-evolving landscape of logistics and corporate services, Cintas Corporation and XPO Logistics, Inc. have emerged as industry titans. Over the past decade, Cintas has seen a steady increase in its cost of revenue, growing by approximately 86% from 2014 to 2023. This reflects its expanding operations and market reach. Meanwhile, XPO Logistics experienced a more volatile trajectory, with its cost of revenue peaking in 2018 at nearly 650% of its 2014 value, before declining by 56% by 2023. This fluctuation highlights the dynamic nature of the logistics sector, influenced by global supply chain challenges and strategic shifts. Notably, data for 2024 is incomplete, suggesting potential changes on the horizon. As these companies navigate the complexities of their industries, their financial strategies will be pivotal in shaping their future growth and stability.
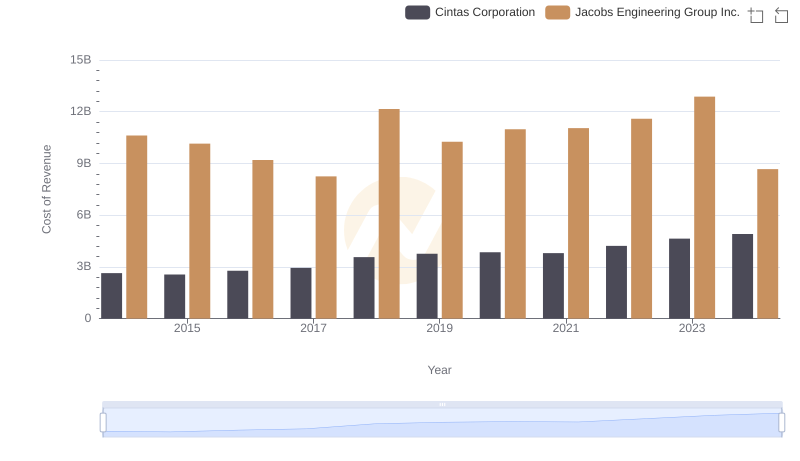
Cintas Corporation vs Jacobs Engineering Group Inc.: Efficiency in Cost of Revenue Explored
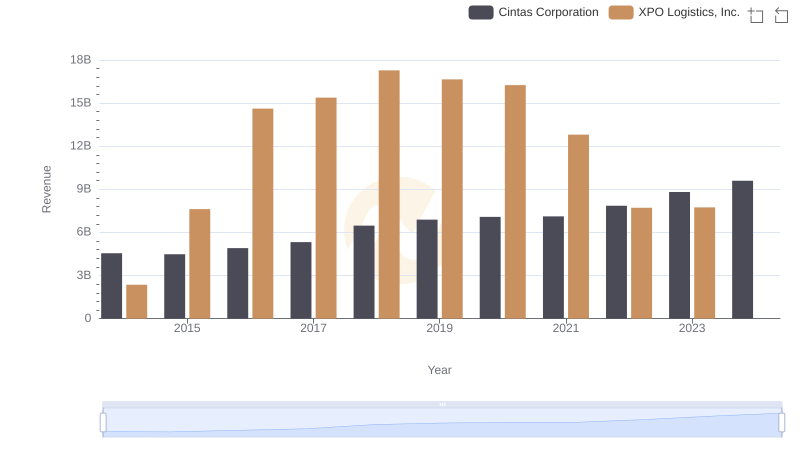
Breaking Down Revenue Trends: Cintas Corporation vs XPO Logistics, Inc.
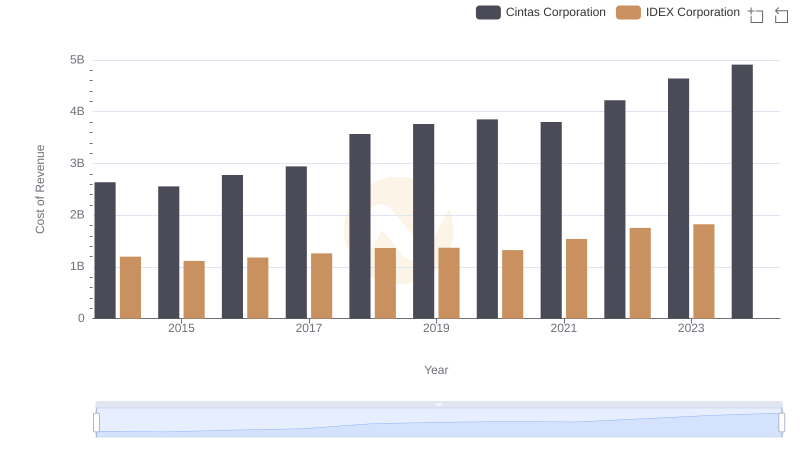
Cintas Corporation vs IDEX Corporation: Efficiency in Cost of Revenue Explored
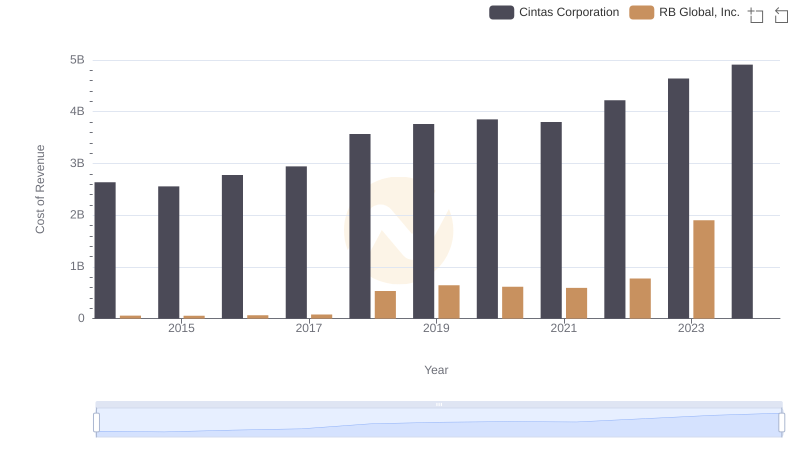
Cintas Corporation vs RB Global, Inc.: Efficiency in Cost of Revenue Explored
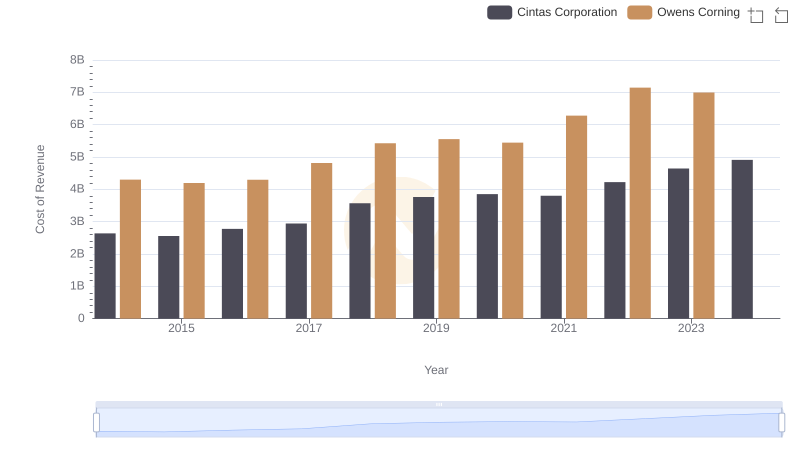
Analyzing Cost of Revenue: Cintas Corporation and Owens Corning
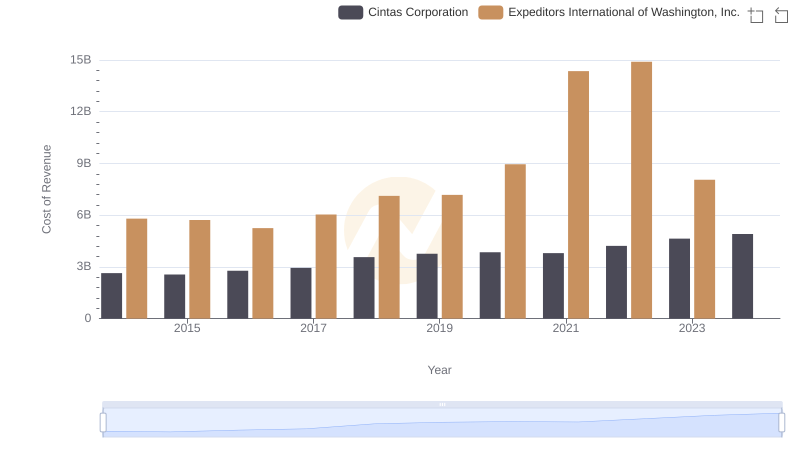
Cost Insights: Breaking Down Cintas Corporation and Expeditors International of Washington, Inc.'s Expenses
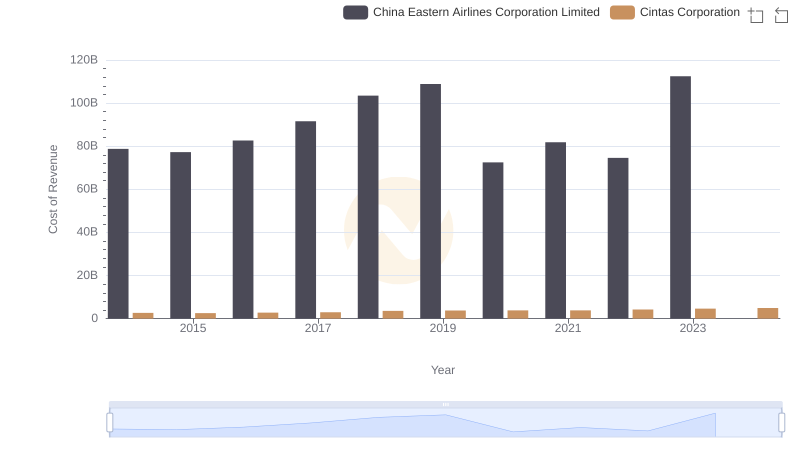
Analyzing Cost of Revenue: Cintas Corporation and China Eastern Airlines Corporation Limited
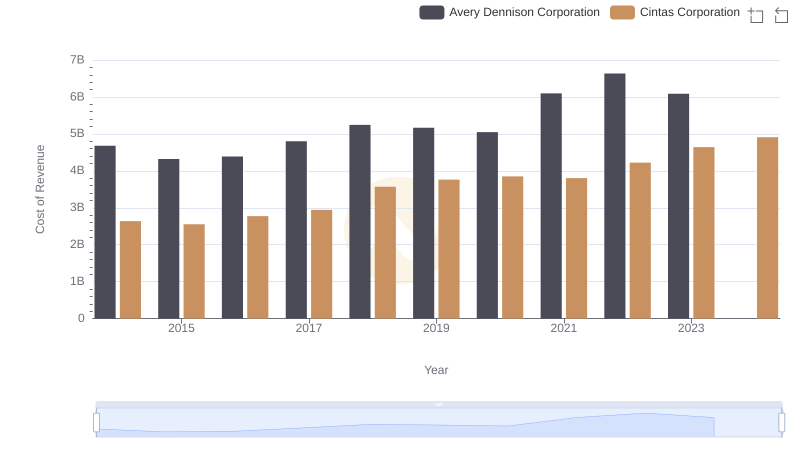
Cost of Revenue: Key Insights for Cintas Corporation and Avery Dennison Corporation
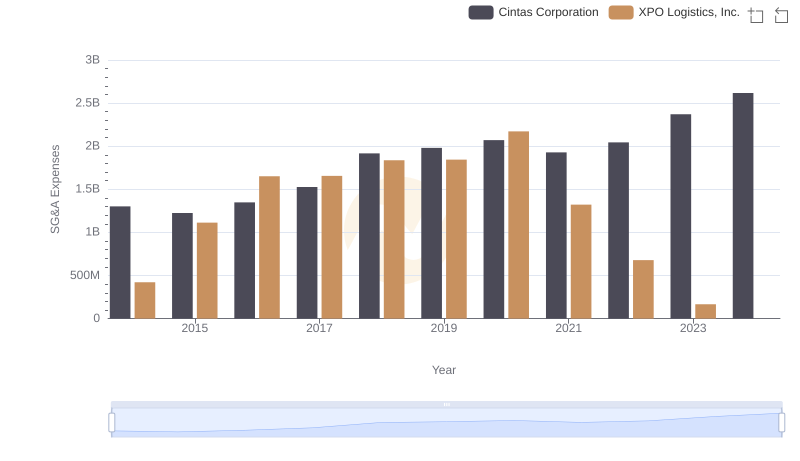
SG&A Efficiency Analysis: Comparing Cintas Corporation and XPO Logistics, Inc.
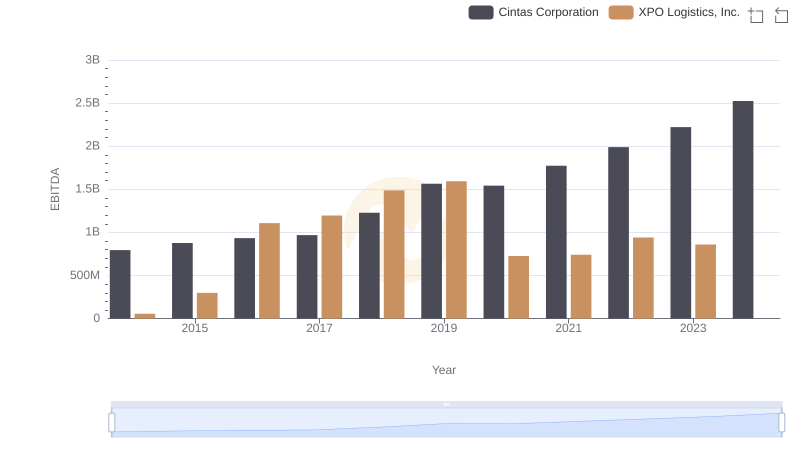
Cintas Corporation and XPO Logistics, Inc.: A Detailed Examination of EBITDA Performance