| __timestamp | Cintas Corporation | RB Global, Inc. |
|---|---|---|
| Wednesday, January 1, 2014 | 2637426000 | 57884000 |
| Thursday, January 1, 2015 | 2555549000 | 56026000 |
| Friday, January 1, 2016 | 2775588000 | 66062000 |
| Sunday, January 1, 2017 | 2943086000 | 79013000 |
| Monday, January 1, 2018 | 3568109000 | 533397000 |
| Tuesday, January 1, 2019 | 3763715000 | 645816000 |
| Wednesday, January 1, 2020 | 3851372000 | 615589000 |
| Friday, January 1, 2021 | 3801689000 | 594783000 |
| Saturday, January 1, 2022 | 4222213000 | 776701000 |
| Sunday, January 1, 2023 | 4642401000 | 1901200000 |
| Monday, January 1, 2024 | 4910199000 | 0 |
Unleashing the power of data
In the competitive landscape of corporate finance, understanding cost efficiency is crucial. This analysis delves into the cost of revenue trends for Cintas Corporation and RB Global, Inc. from 2014 to 2023. Over this decade, Cintas Corporation consistently demonstrated a robust cost management strategy, with its cost of revenue peaking at approximately $4.9 billion in 2023, marking a 86% increase from 2014. In contrast, RB Global, Inc. experienced a more volatile trajectory, with a significant spike in 2023, reaching nearly $1.9 billion, a staggering 3,180% increase from 2014. This disparity highlights Cintas's steady growth and RB Global's fluctuating cost structure. Notably, data for 2024 is incomplete, suggesting a need for further analysis. This comparison underscores the importance of strategic cost management in sustaining corporate growth and profitability.
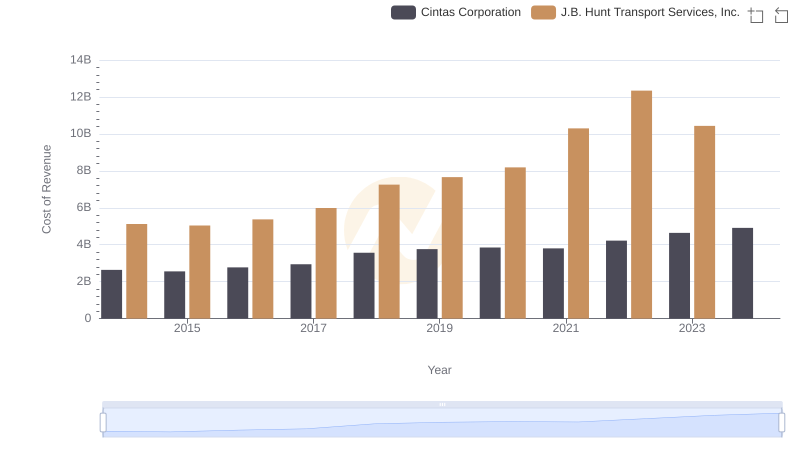
Cintas Corporation vs J.B. Hunt Transport Services, Inc.: Efficiency in Cost of Revenue Explored
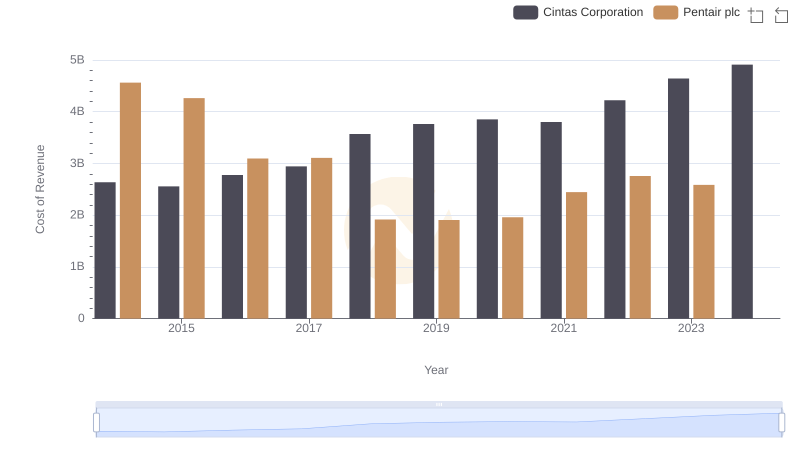
Cost of Revenue Comparison: Cintas Corporation vs Pentair plc
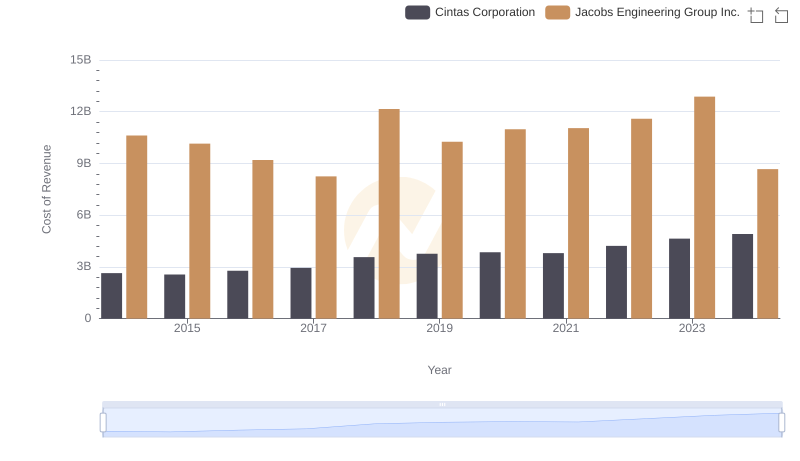
Cintas Corporation vs Jacobs Engineering Group Inc.: Efficiency in Cost of Revenue Explored
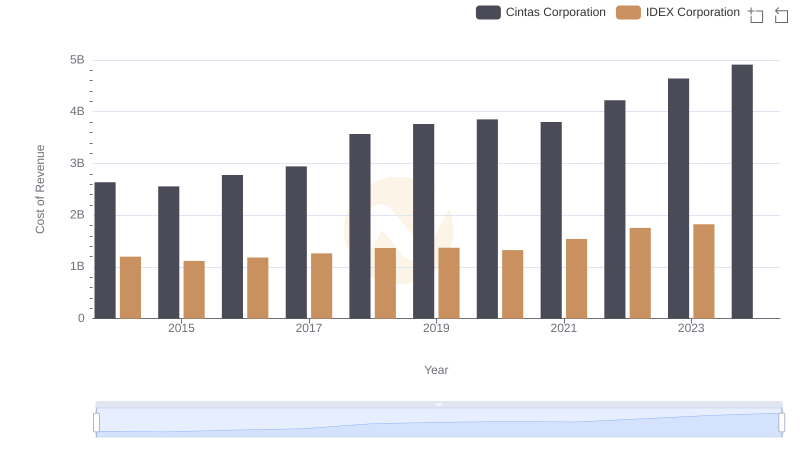
Cintas Corporation vs IDEX Corporation: Efficiency in Cost of Revenue Explored
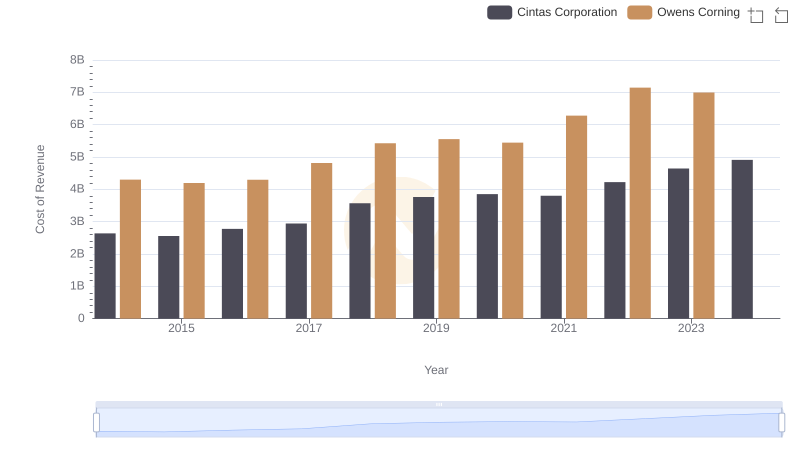
Analyzing Cost of Revenue: Cintas Corporation and Owens Corning
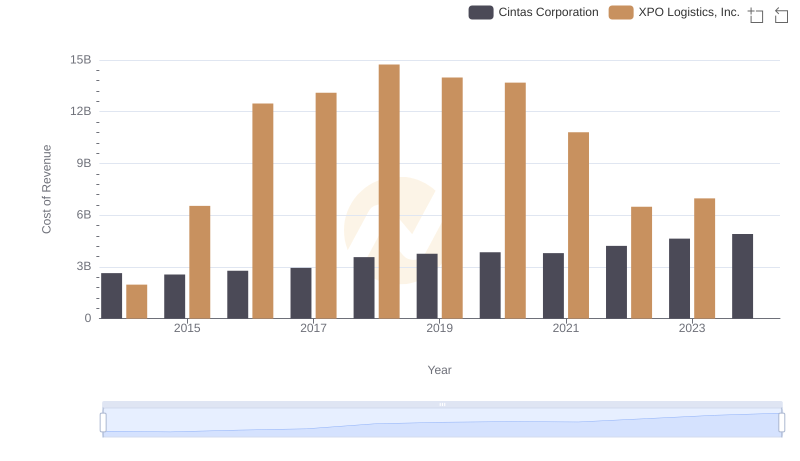
Cost of Revenue Comparison: Cintas Corporation vs XPO Logistics, Inc.
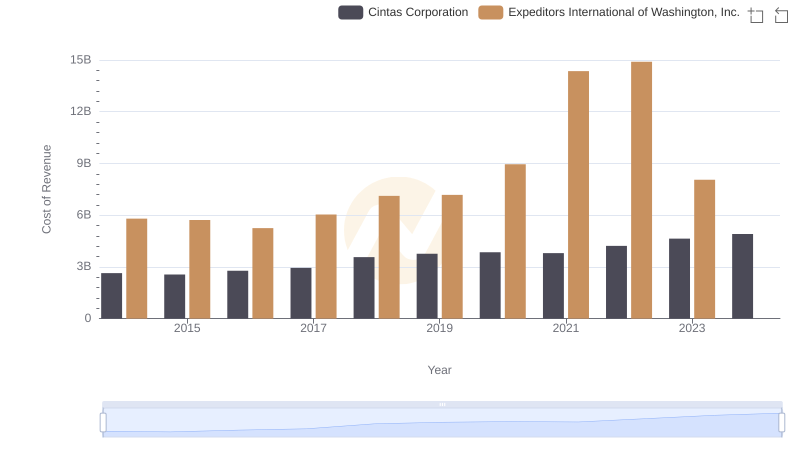
Cost Insights: Breaking Down Cintas Corporation and Expeditors International of Washington, Inc.'s Expenses
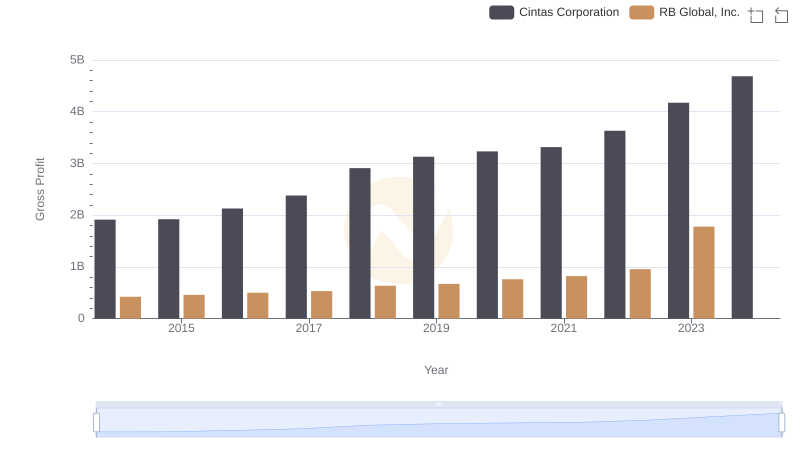
Key Insights on Gross Profit: Cintas Corporation vs RB Global, Inc.
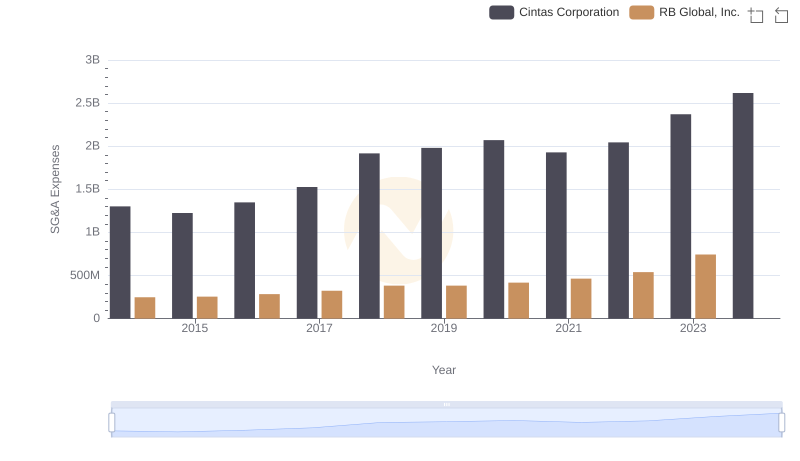
Cintas Corporation and RB Global, Inc.: SG&A Spending Patterns Compared
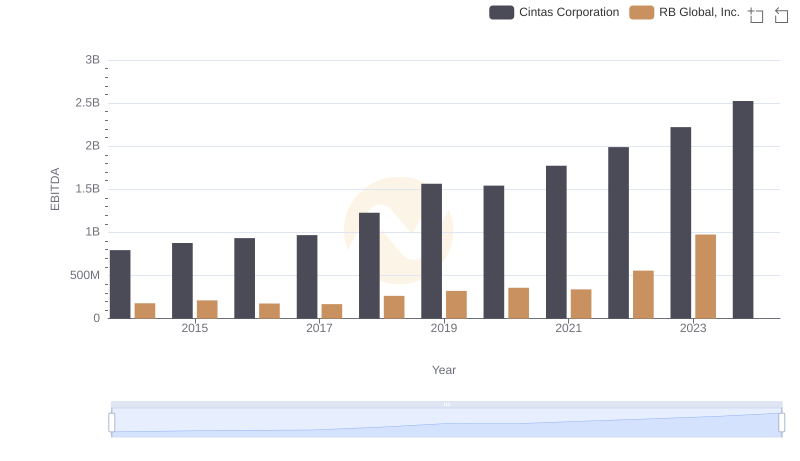
Cintas Corporation and RB Global, Inc.: A Detailed Examination of EBITDA Performance