| __timestamp | Rockwell Automation, Inc. | United Rentals, Inc. |
|---|---|---|
| Wednesday, January 1, 2014 | 1346000000 | 1678000000 |
| Thursday, January 1, 2015 | 1359100000 | 2653000000 |
| Friday, January 1, 2016 | 1200700000 | 2566000000 |
| Sunday, January 1, 2017 | 1258400000 | 2843000000 |
| Monday, January 1, 2018 | 1568400000 | 3628000000 |
| Tuesday, January 1, 2019 | 1150200000 | 4200000000 |
| Wednesday, January 1, 2020 | 1410200000 | 2195000000 |
| Friday, January 1, 2021 | 1808300000 | 2642000000 |
| Saturday, January 1, 2022 | 1432100000 | 5464000000 |
| Sunday, January 1, 2023 | 1990700000 | 6627000000 |
| Monday, January 1, 2024 | 1567500000 | 4516000000 |
Unleashing the power of data
In the ever-evolving landscape of industrial giants, United Rentals, Inc. and Rockwell Automation, Inc. have carved distinct paths over the past decade. From 2014 to 2023, United Rentals has consistently outpaced Rockwell Automation in EBITDA growth, showcasing a remarkable 295% increase, peaking in 2023. This surge underscores United Rentals' strategic prowess in capitalizing on market opportunities and expanding its operational footprint.
Conversely, Rockwell Automation, while maintaining steady growth, has seen a more modest 48% rise in EBITDA over the same period. This reflects its focus on innovation and automation solutions, catering to a niche market with precision. The data reveals a fascinating narrative of two companies with divergent strategies yet thriving in their respective domains.
As we look to the future, the question remains: will United Rentals continue its aggressive expansion, or will Rockwell Automation's steady approach yield greater dividends?

Annual Revenue Comparison: United Rentals, Inc. vs Rockwell Automation, Inc.
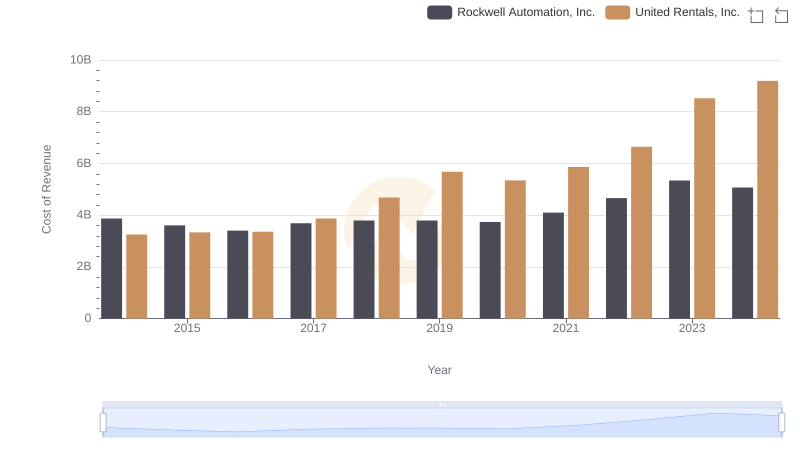
Cost of Revenue Comparison: United Rentals, Inc. vs Rockwell Automation, Inc.
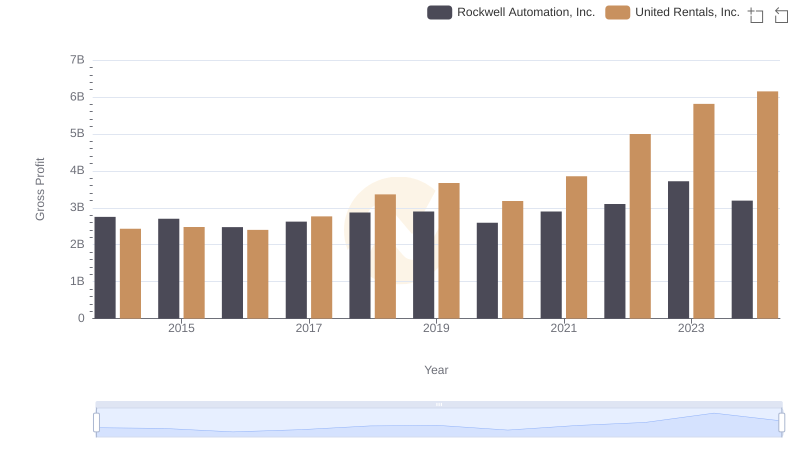
Who Generates Higher Gross Profit? United Rentals, Inc. or Rockwell Automation, Inc.
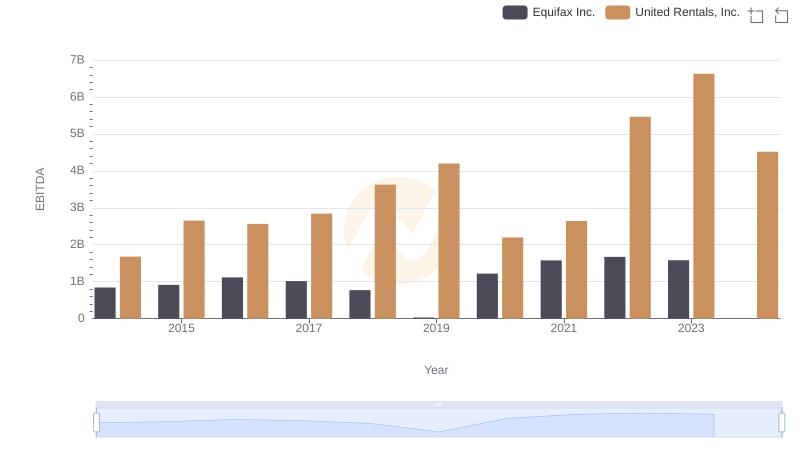
EBITDA Performance Review: United Rentals, Inc. vs Equifax Inc.
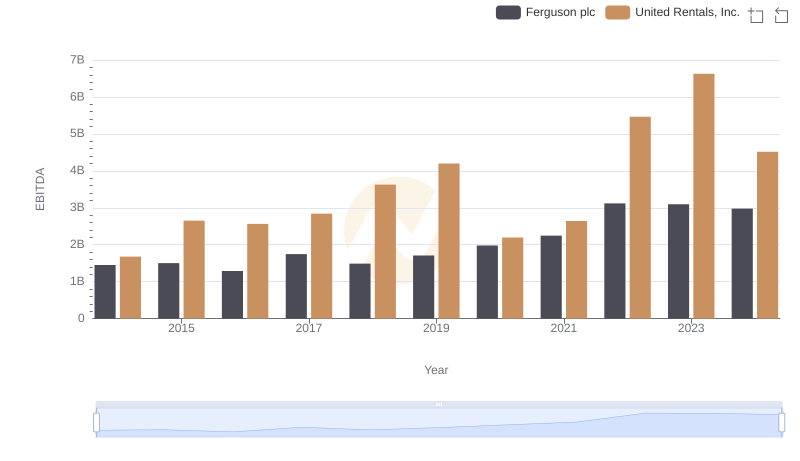
Comprehensive EBITDA Comparison: United Rentals, Inc. vs Ferguson plc
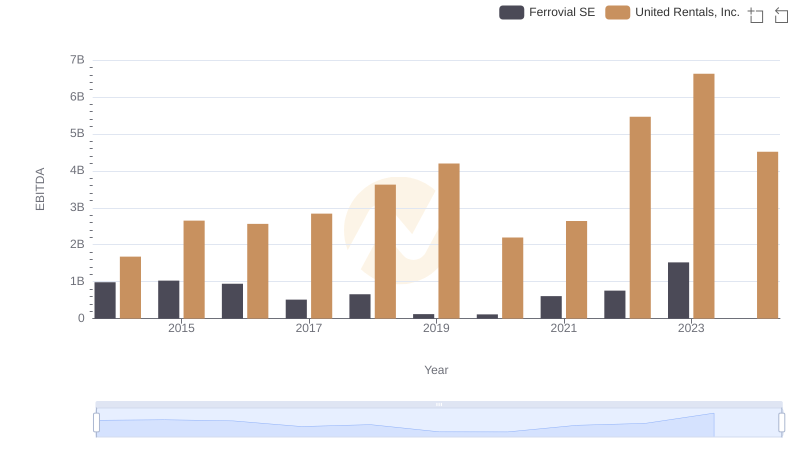
United Rentals, Inc. vs Ferrovial SE: In-Depth EBITDA Performance Comparison
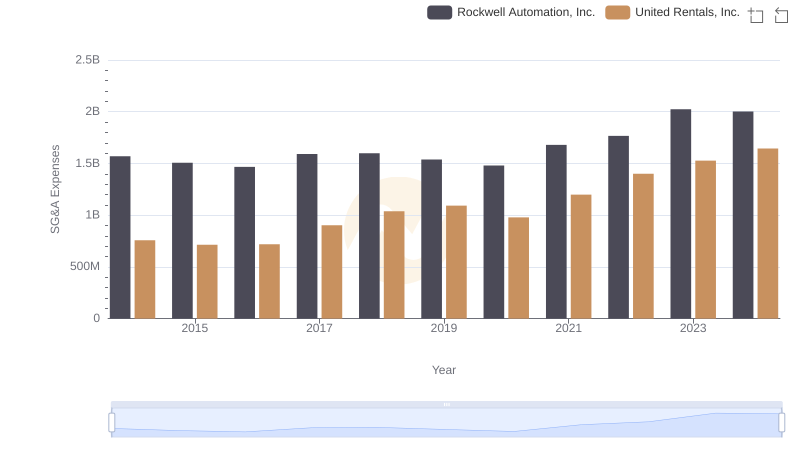
United Rentals, Inc. vs Rockwell Automation, Inc.: SG&A Expense Trends
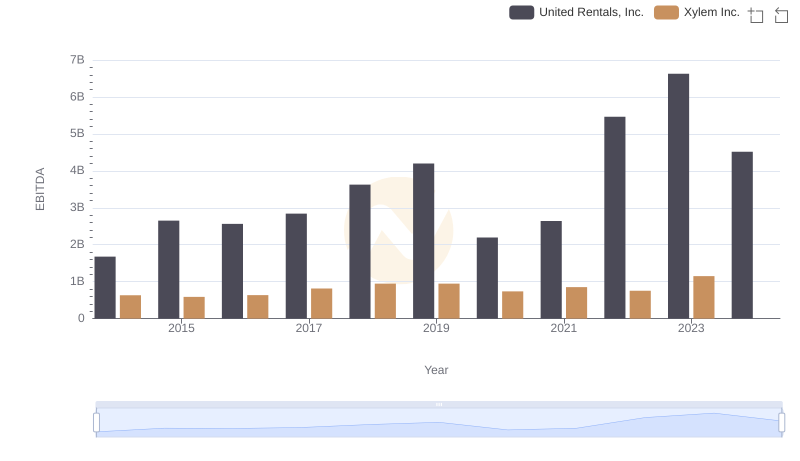
A Side-by-Side Analysis of EBITDA: United Rentals, Inc. and Xylem Inc.
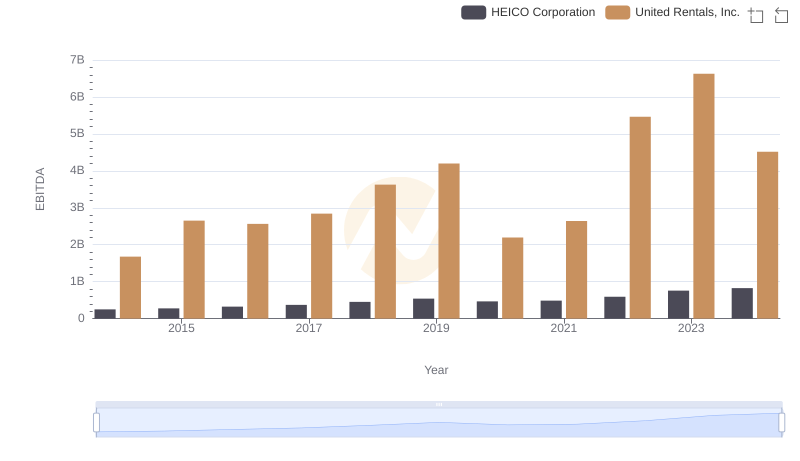
United Rentals, Inc. vs HEICO Corporation: In-Depth EBITDA Performance Comparison
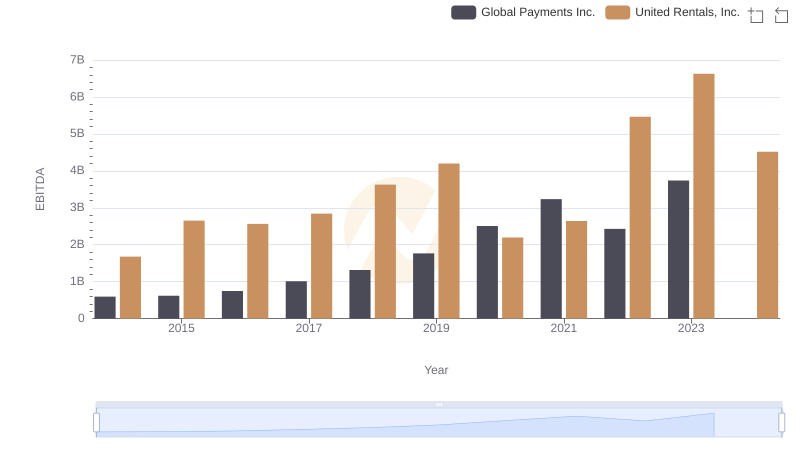
A Side-by-Side Analysis of EBITDA: United Rentals, Inc. and Global Payments Inc.
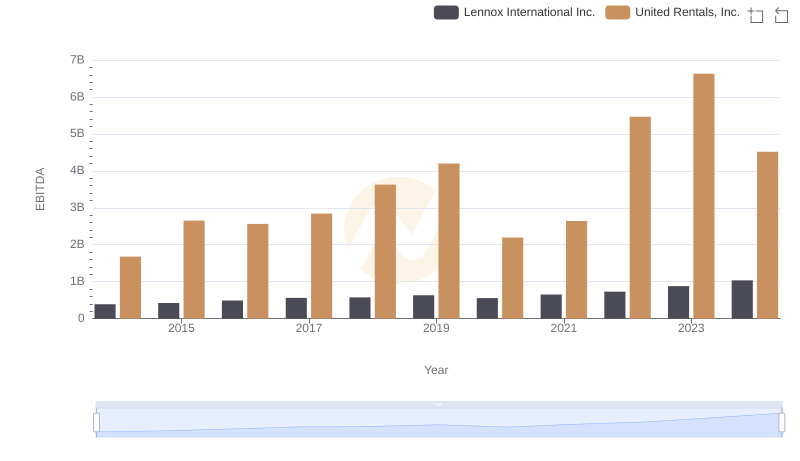
EBITDA Performance Review: United Rentals, Inc. vs Lennox International Inc.
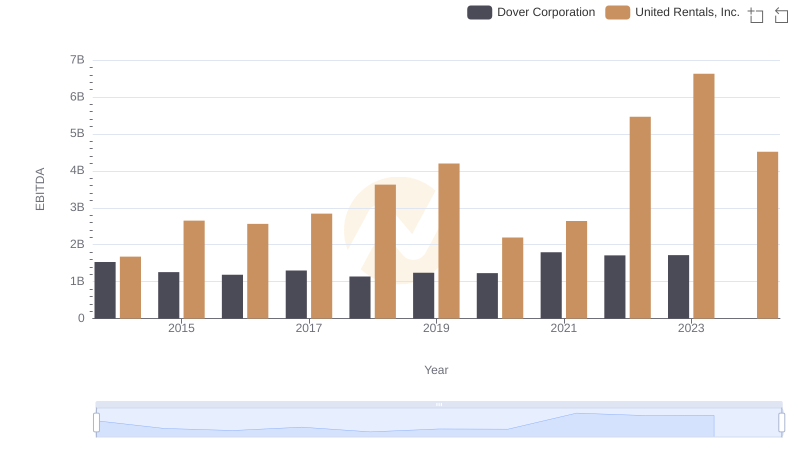
Comparative EBITDA Analysis: United Rentals, Inc. vs Dover Corporation