| __timestamp | Booz Allen Hamilton Holding Corporation | Lennox International Inc. |
|---|---|---|
| Wednesday, January 1, 2014 | 5478693000 | 3367400000 |
| Thursday, January 1, 2015 | 5274770000 | 3467400000 |
| Friday, January 1, 2016 | 5405738000 | 3641600000 |
| Sunday, January 1, 2017 | 5804284000 | 3839600000 |
| Monday, January 1, 2018 | 6171853000 | 3883900000 |
| Tuesday, January 1, 2019 | 6704037000 | 3807200000 |
| Wednesday, January 1, 2020 | 7463841000 | 3634100000 |
| Friday, January 1, 2021 | 7858938000 | 4194100000 |
| Saturday, January 1, 2022 | 8363700000 | 4718400000 |
| Sunday, January 1, 2023 | 9258911000 | 4981900000 |
| Monday, January 1, 2024 | 10661896000 | 5341300000 |
In pursuit of knowledge
In the ever-evolving landscape of corporate America, revenue growth is a key indicator of a company's success. Over the past decade, Booz Allen Hamilton Holding Corporation and Lennox International Inc. have demonstrated distinct revenue trajectories. From 2014 to 2024, Booz Allen Hamilton's revenue surged by approximately 95%, reflecting its robust expansion in the consulting sector. In contrast, Lennox International, a leader in climate control solutions, saw a commendable 59% increase in revenue during the same period.
Booz Allen Hamilton's revenue growth was particularly notable in the last few years, with a 14% increase from 2022 to 2024 alone. Meanwhile, Lennox International experienced a steady climb, with a 13% rise in the same timeframe. These trends highlight the dynamic nature of these industries and the strategic maneuvers each company has employed to maintain their competitive edge.
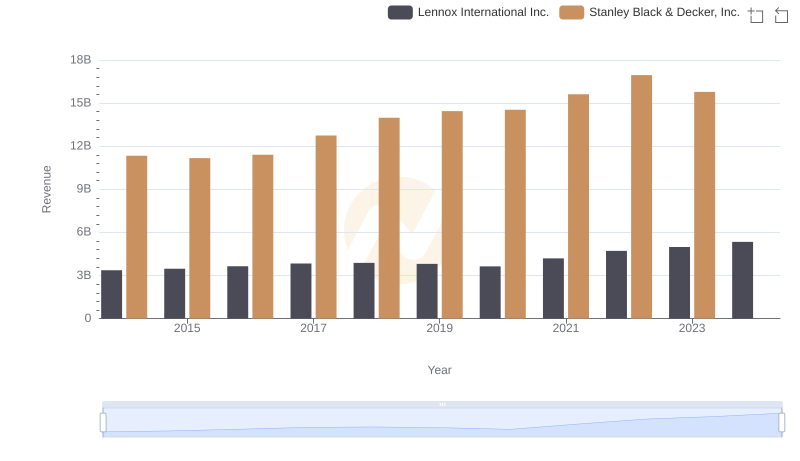
Lennox International Inc. vs Stanley Black & Decker, Inc.: Annual Revenue Growth Compared
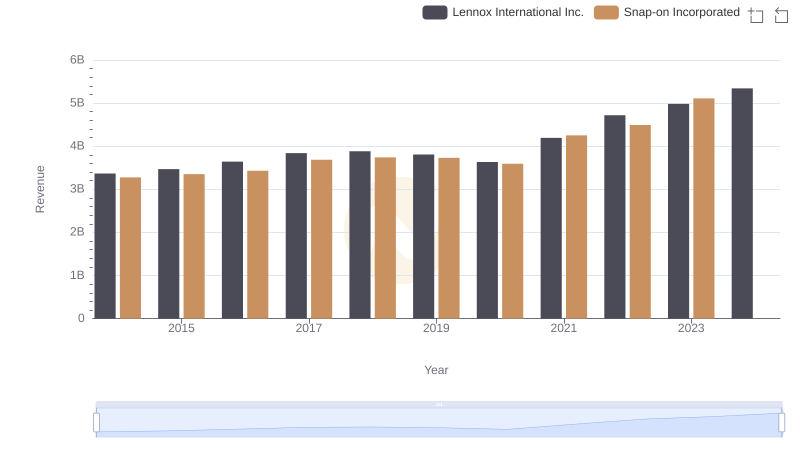
Lennox International Inc. vs Snap-on Incorporated: Examining Key Revenue Metrics
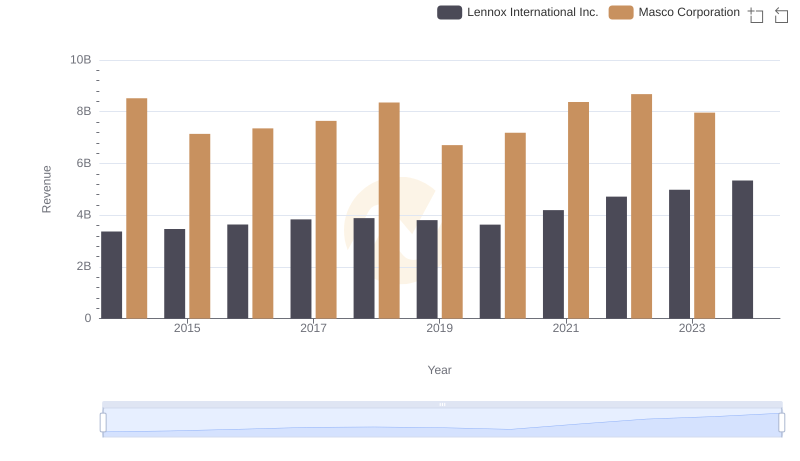
Lennox International Inc. vs Masco Corporation: Annual Revenue Growth Compared
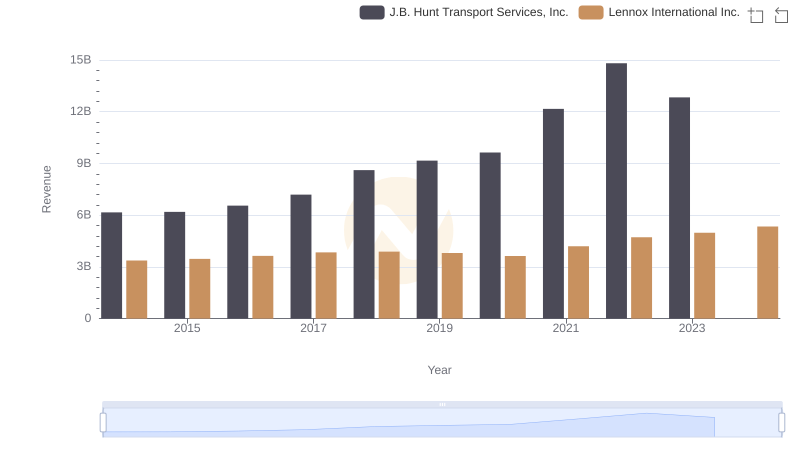
Lennox International Inc. or J.B. Hunt Transport Services, Inc.: Who Leads in Yearly Revenue?
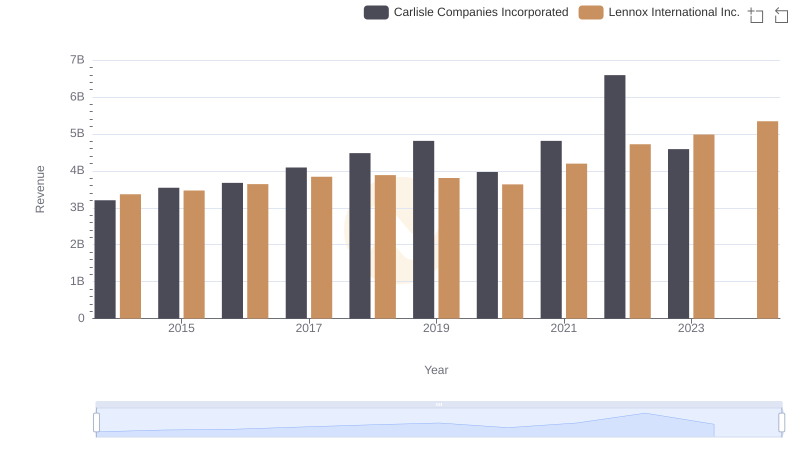
Lennox International Inc. or Carlisle Companies Incorporated: Who Leads in Yearly Revenue?
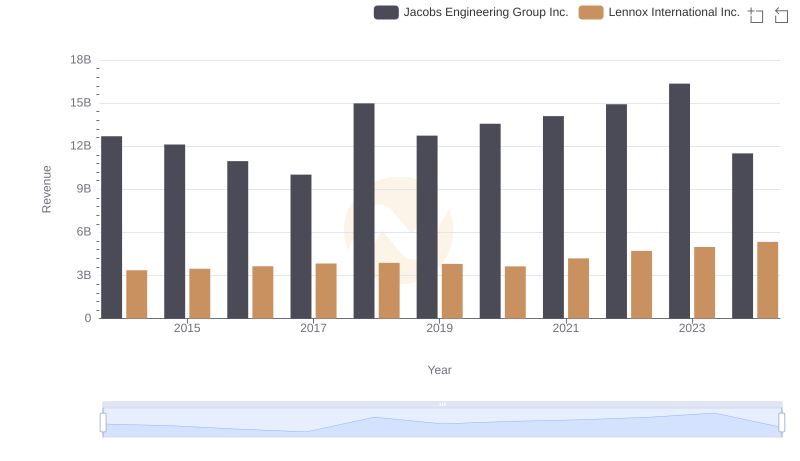
Revenue Showdown: Lennox International Inc. vs Jacobs Engineering Group Inc.
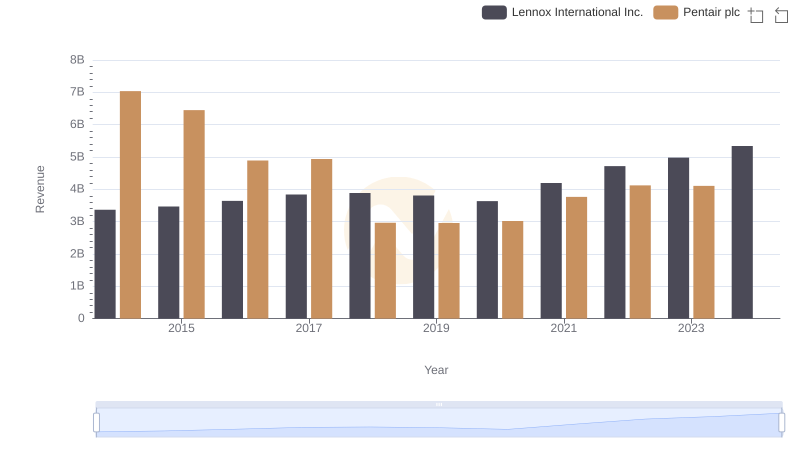
Lennox International Inc. and Pentair plc: A Comprehensive Revenue Analysis
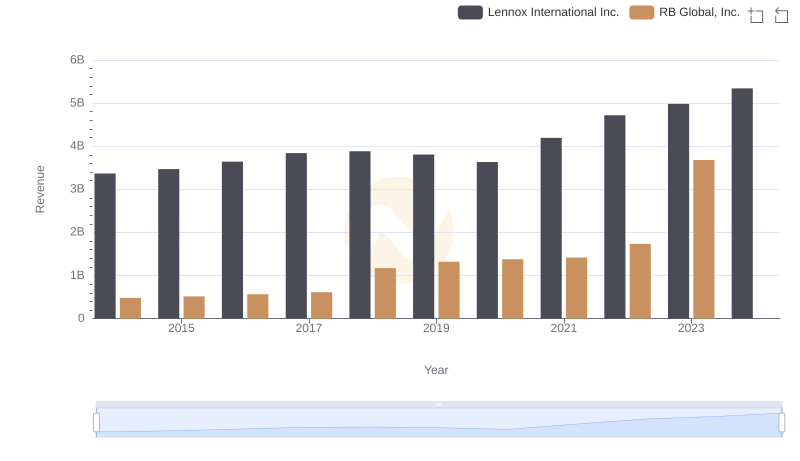
Comparing Revenue Performance: Lennox International Inc. or RB Global, Inc.?
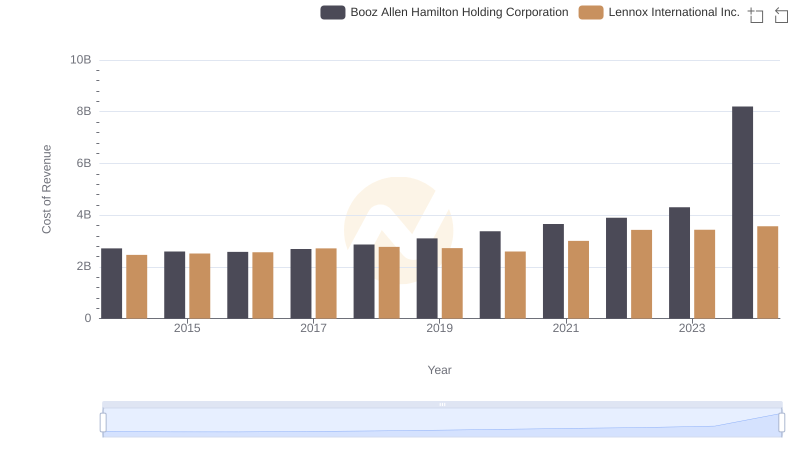
Analyzing Cost of Revenue: Lennox International Inc. and Booz Allen Hamilton Holding Corporation
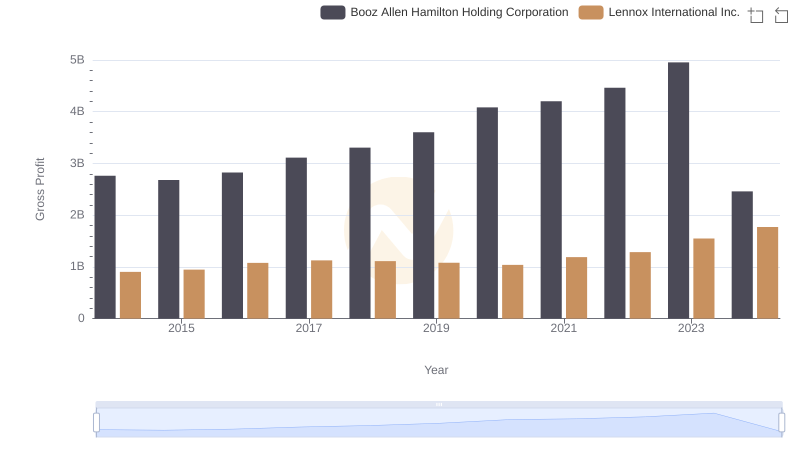
Gross Profit Trends Compared: Lennox International Inc. vs Booz Allen Hamilton Holding Corporation
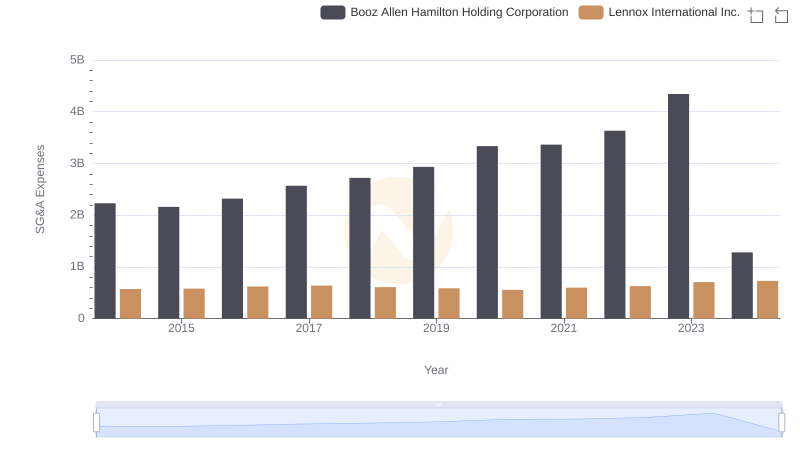
Selling, General, and Administrative Costs: Lennox International Inc. vs Booz Allen Hamilton Holding Corporation
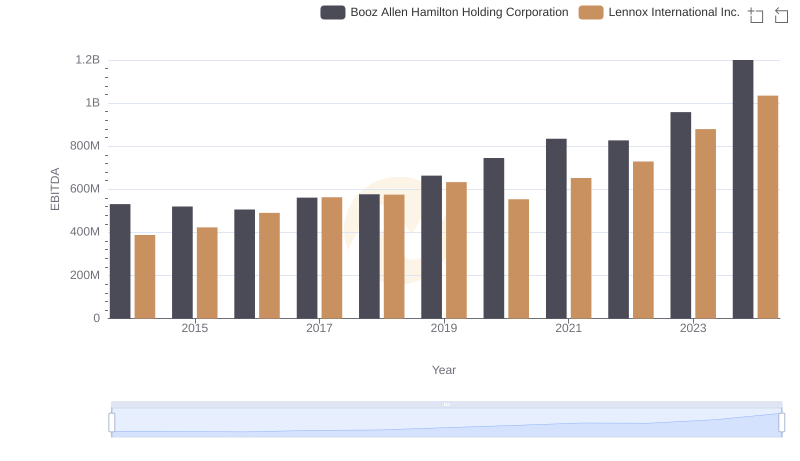
A Side-by-Side Analysis of EBITDA: Lennox International Inc. and Booz Allen Hamilton Holding Corporation