| __timestamp | Intuit Inc. | Trimble Inc. |
|---|---|---|
| Wednesday, January 1, 2014 | 1528000000 | 476337000 |
| Thursday, January 1, 2015 | 970000000 | 376200000 |
| Friday, January 1, 2016 | 1480000000 | 388300000 |
| Sunday, January 1, 2017 | 1634000000 | 478100000 |
| Monday, January 1, 2018 | 1839000000 | 590000000 |
| Tuesday, January 1, 2019 | 2121000000 | 656700000 |
| Wednesday, January 1, 2020 | 2430000000 | 692900000 |
| Friday, January 1, 2021 | 2948000000 | 845800000 |
| Saturday, January 1, 2022 | 3369000000 | 747400000 |
| Sunday, January 1, 2023 | 4043000000 | 768600000 |
| Monday, January 1, 2024 | 4581000000 |
Infusing magic into the data realm
In the ever-evolving landscape of financial technology and geospatial solutions, Intuit Inc. and Trimble Inc. have emerged as key players. Over the past decade, Intuit has demonstrated a remarkable growth trajectory, with its EBITDA increasing by approximately 200% from 2014 to 2023. This growth underscores Intuit's strategic focus on innovation and customer-centric solutions, propelling it to the forefront of the industry.
Conversely, Trimble Inc. has shown steady, albeit more modest, growth. From 2014 to 2023, Trimble's EBITDA rose by about 60%, reflecting its commitment to enhancing operational efficiencies and expanding its market reach. However, the data for 2024 remains incomplete, highlighting potential areas for future analysis.
As we look to the future, the comparative analysis of these two industry giants offers valuable insights into their strategic directions and market dynamics, providing a window into the evolving trends of their respective sectors.
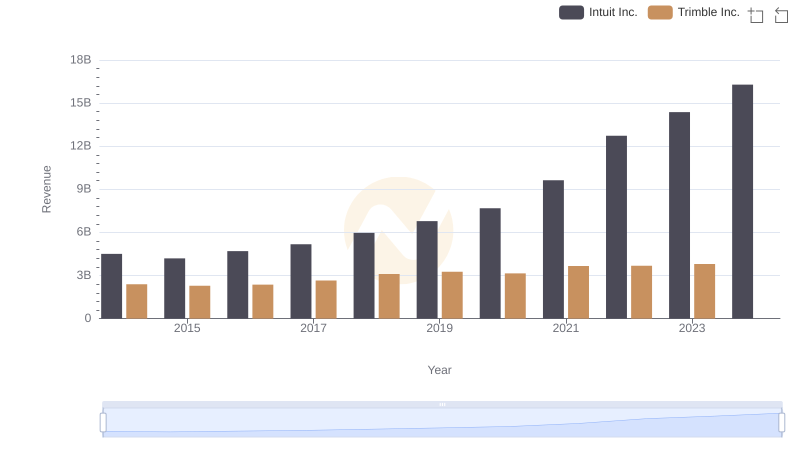
Breaking Down Revenue Trends: Intuit Inc. vs Trimble Inc.
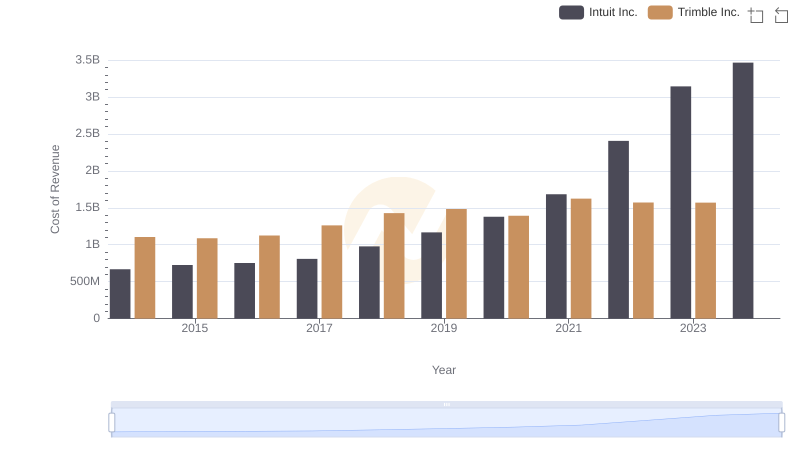
Comparing Cost of Revenue Efficiency: Intuit Inc. vs Trimble Inc.
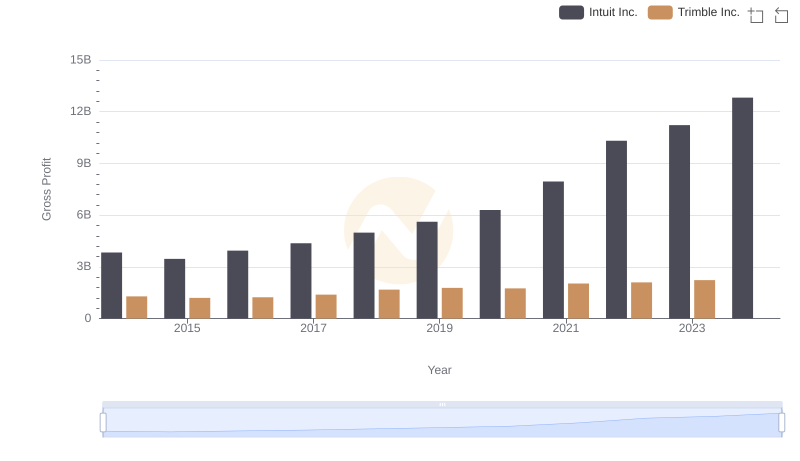
Key Insights on Gross Profit: Intuit Inc. vs Trimble Inc.
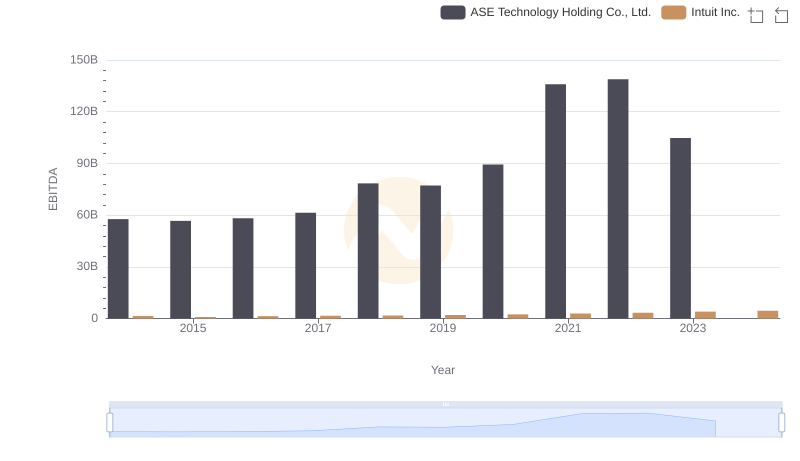
EBITDA Metrics Evaluated: Intuit Inc. vs ASE Technology Holding Co., Ltd.

R&D Insights: How Intuit Inc. and Trimble Inc. Allocate Funds
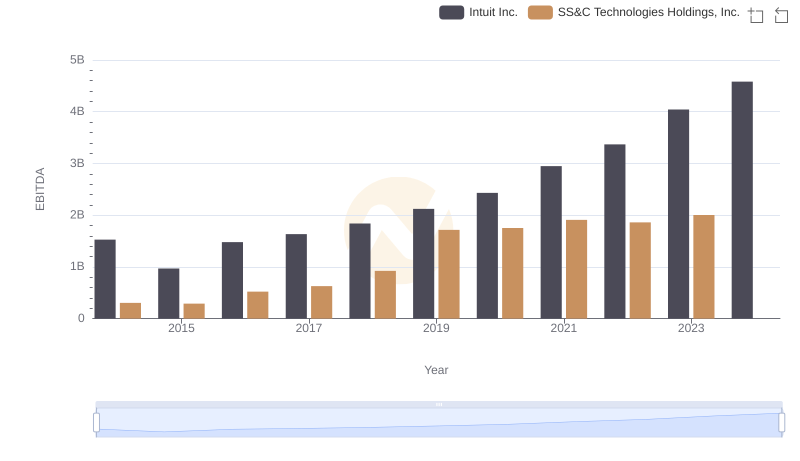
EBITDA Performance Review: Intuit Inc. vs SS&C Technologies Holdings, Inc.
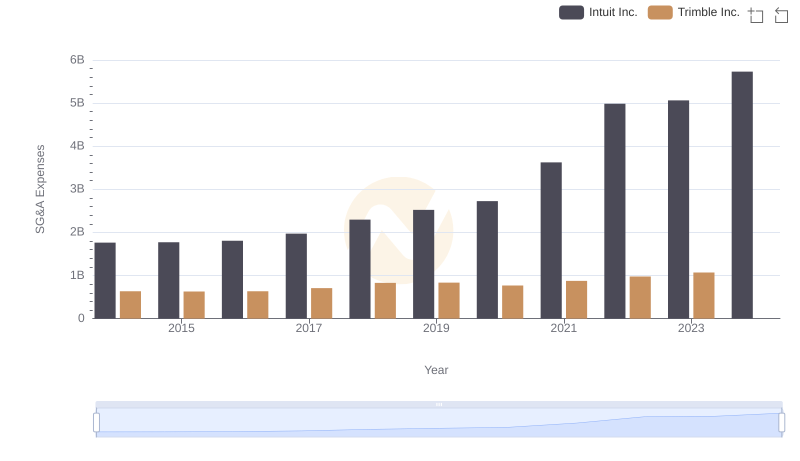
Intuit Inc. or Trimble Inc.: Who Manages SG&A Costs Better?
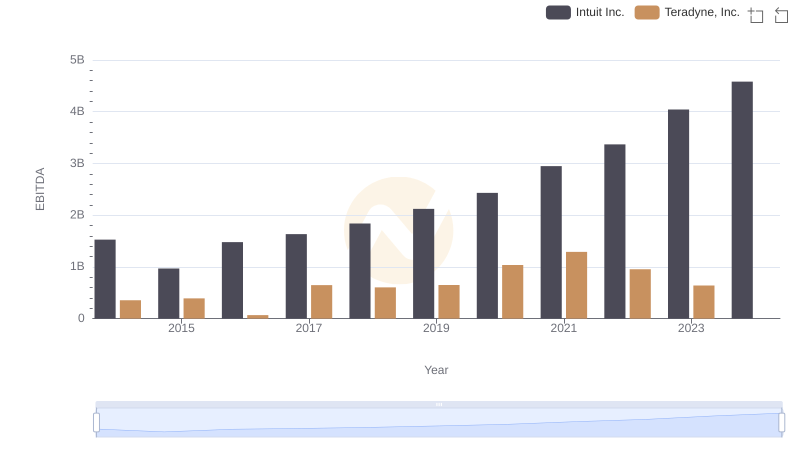
A Side-by-Side Analysis of EBITDA: Intuit Inc. and Teradyne, Inc.
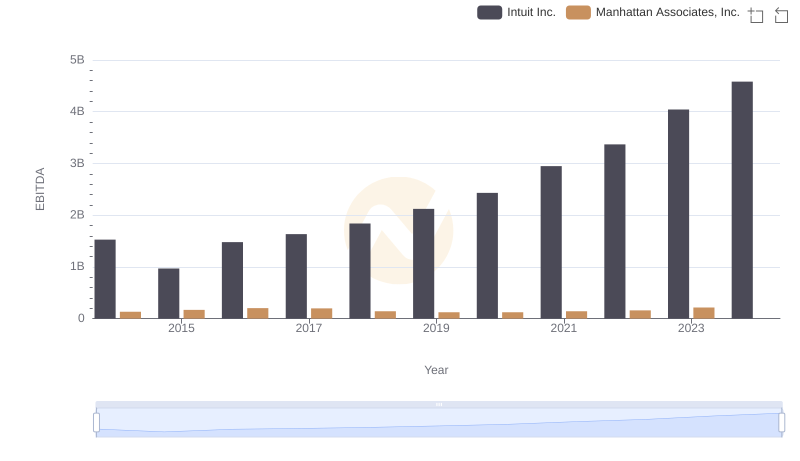
Comprehensive EBITDA Comparison: Intuit Inc. vs Manhattan Associates, Inc.
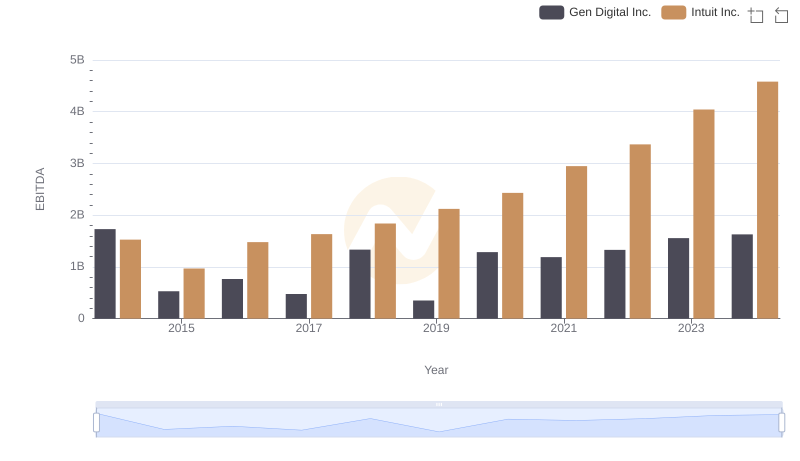
EBITDA Metrics Evaluated: Intuit Inc. vs Gen Digital Inc.
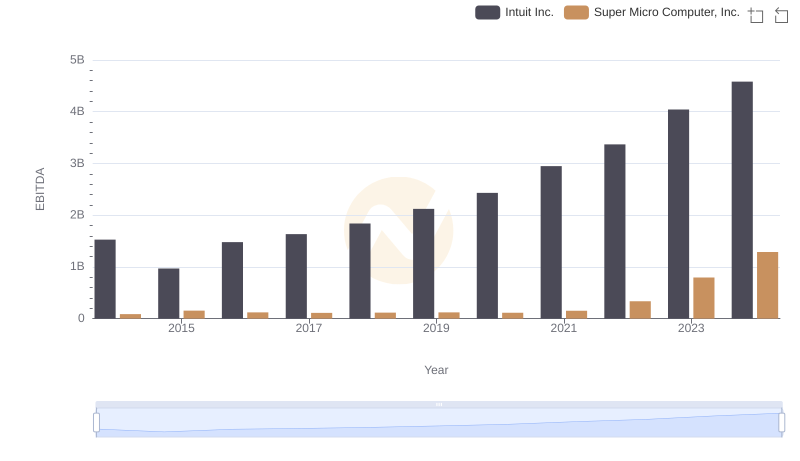
A Side-by-Side Analysis of EBITDA: Intuit Inc. and Super Micro Computer, Inc.
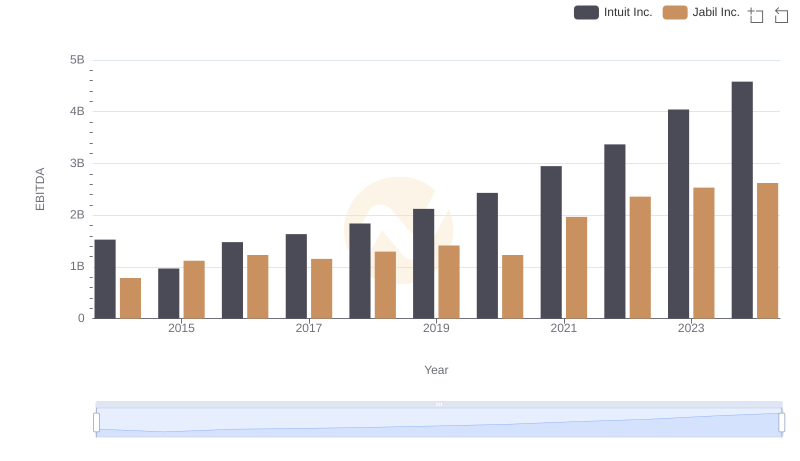
Comprehensive EBITDA Comparison: Intuit Inc. vs Jabil Inc.