| __timestamp | Intuit Inc. | Manhattan Associates, Inc. |
|---|---|---|
| Wednesday, January 1, 2014 | 1528000000 | 133501000 |
| Thursday, January 1, 2015 | 970000000 | 169210000 |
| Friday, January 1, 2016 | 1480000000 | 203397000 |
| Sunday, January 1, 2017 | 1634000000 | 197626000 |
| Monday, January 1, 2018 | 1839000000 | 142500000 |
| Tuesday, January 1, 2019 | 2121000000 | 123911000 |
| Wednesday, January 1, 2020 | 2430000000 | 123007000 |
| Friday, January 1, 2021 | 2948000000 | 142247000 |
| Saturday, January 1, 2022 | 3369000000 | 159363000 |
| Sunday, January 1, 2023 | 4043000000 | 215633000 |
| Monday, January 1, 2024 | 4581000000 | 267897000 |
Infusing magic into the data realm
In the ever-evolving landscape of financial technology and software solutions, Intuit Inc. and Manhattan Associates, Inc. have emerged as key players. Over the past decade, Intuit has demonstrated a remarkable growth trajectory, with its EBITDA increasing by approximately 200% from 2014 to 2024. This growth underscores Intuit's strategic focus on innovation and customer-centric solutions.
Conversely, Manhattan Associates, Inc. has shown steady progress, with its EBITDA rising by around 105% over the same period. This growth reflects the company's commitment to enhancing supply chain and omnichannel commerce solutions.
The data reveals a compelling narrative of two companies navigating their respective markets with distinct strategies. As Intuit continues to expand its footprint in financial software, Manhattan Associates remains a formidable force in supply chain optimization. This comparison offers valuable insights into the dynamic nature of the tech industry.
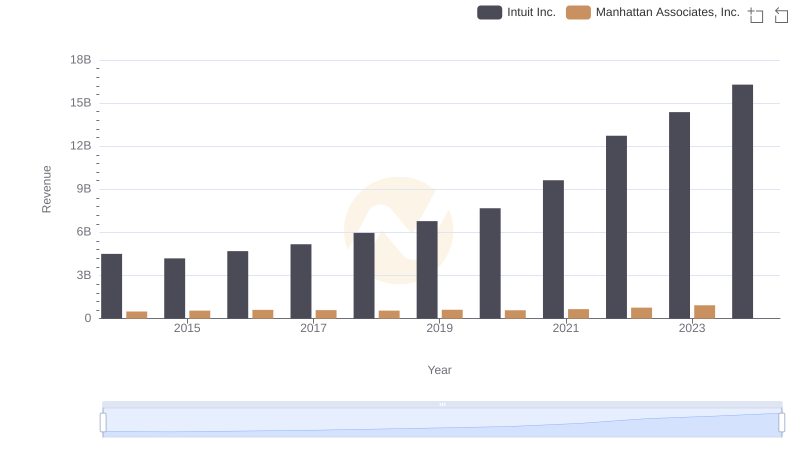
Annual Revenue Comparison: Intuit Inc. vs Manhattan Associates, Inc.
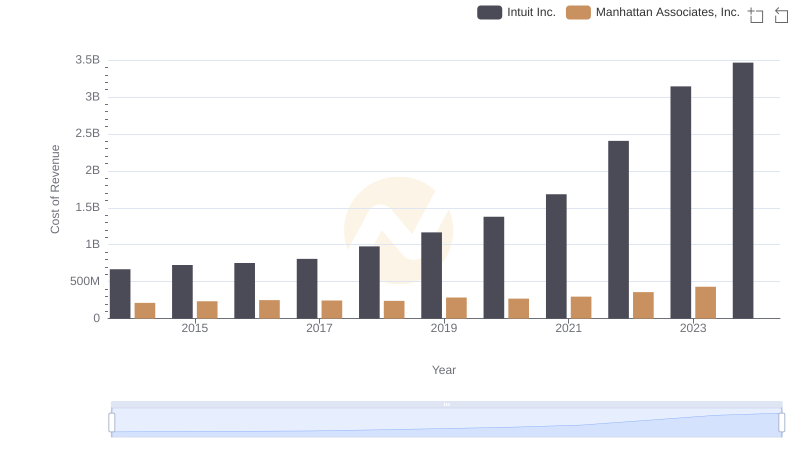
Analyzing Cost of Revenue: Intuit Inc. and Manhattan Associates, Inc.

Gross Profit Trends Compared: Intuit Inc. vs Manhattan Associates, Inc.
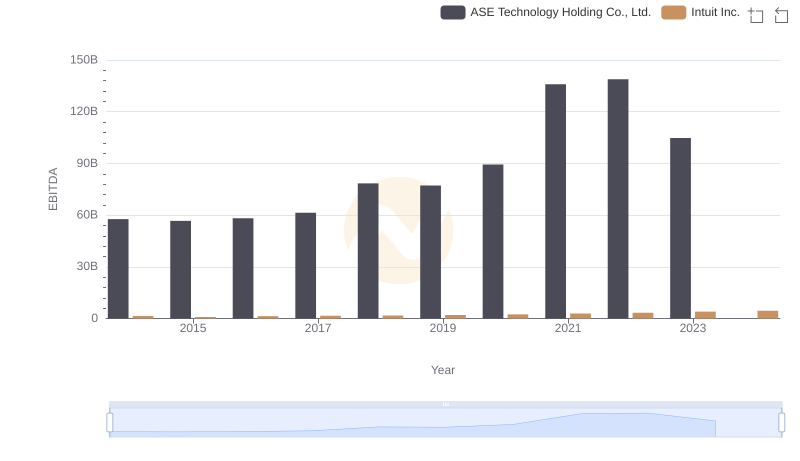
EBITDA Metrics Evaluated: Intuit Inc. vs ASE Technology Holding Co., Ltd.
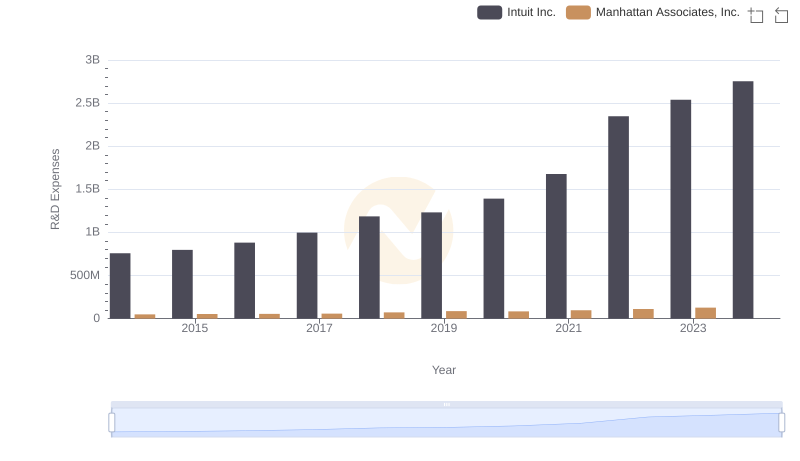
R&D Spending Showdown: Intuit Inc. vs Manhattan Associates, Inc.
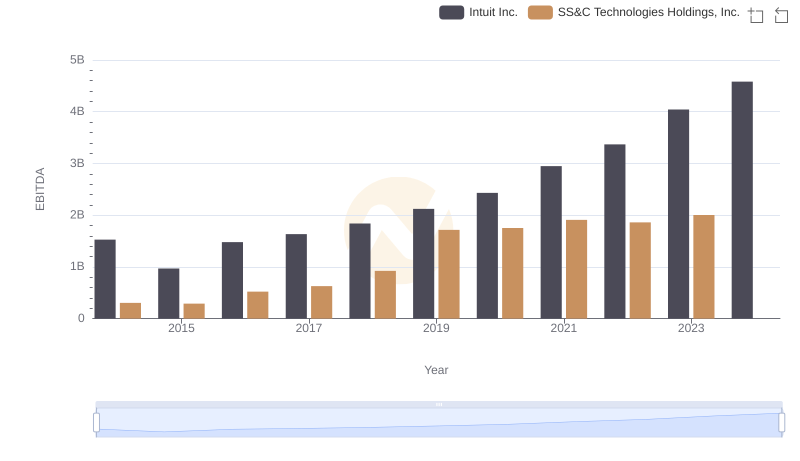
EBITDA Performance Review: Intuit Inc. vs SS&C Technologies Holdings, Inc.
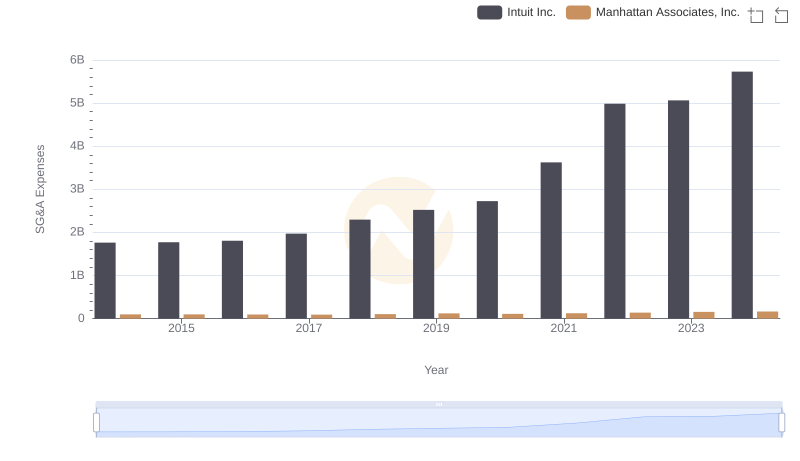
Intuit Inc. vs Manhattan Associates, Inc.: SG&A Expense Trends
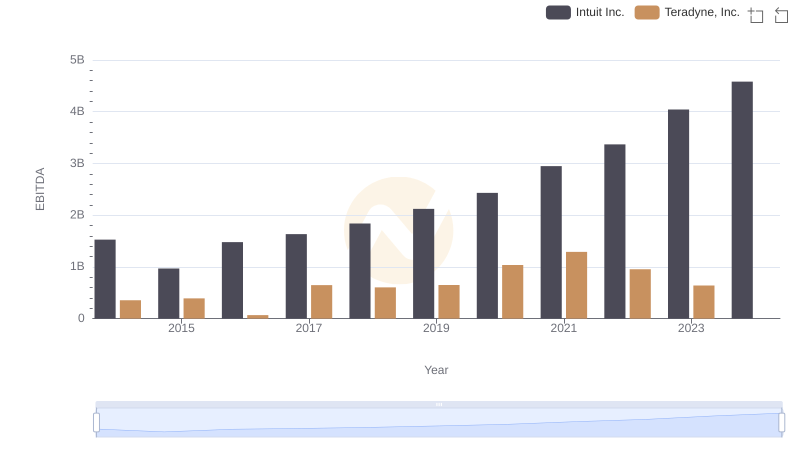
A Side-by-Side Analysis of EBITDA: Intuit Inc. and Teradyne, Inc.
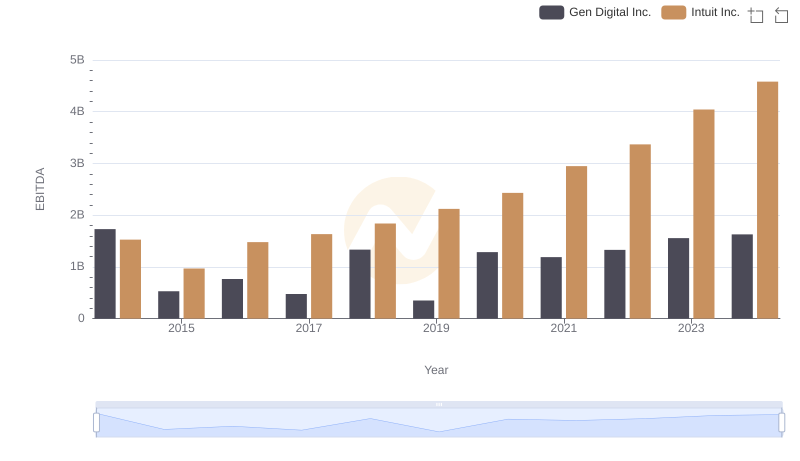
EBITDA Metrics Evaluated: Intuit Inc. vs Gen Digital Inc.
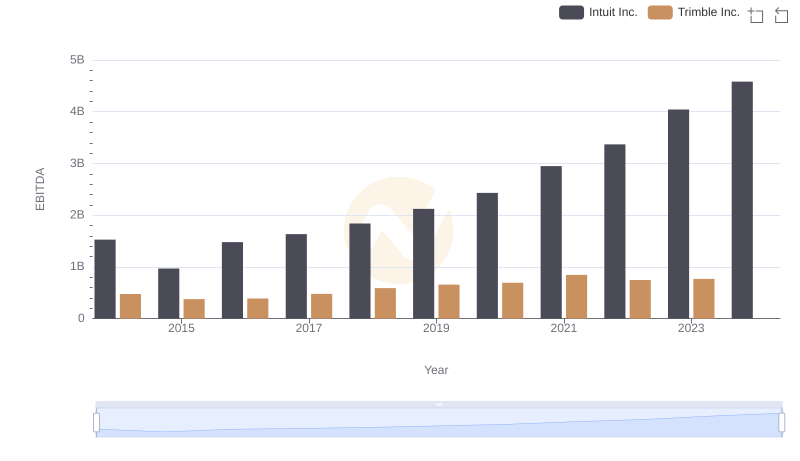
Comparative EBITDA Analysis: Intuit Inc. vs Trimble Inc.
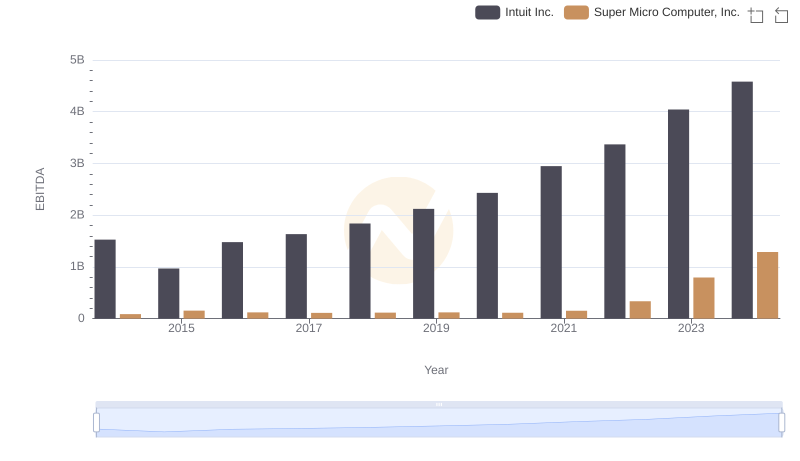
A Side-by-Side Analysis of EBITDA: Intuit Inc. and Super Micro Computer, Inc.
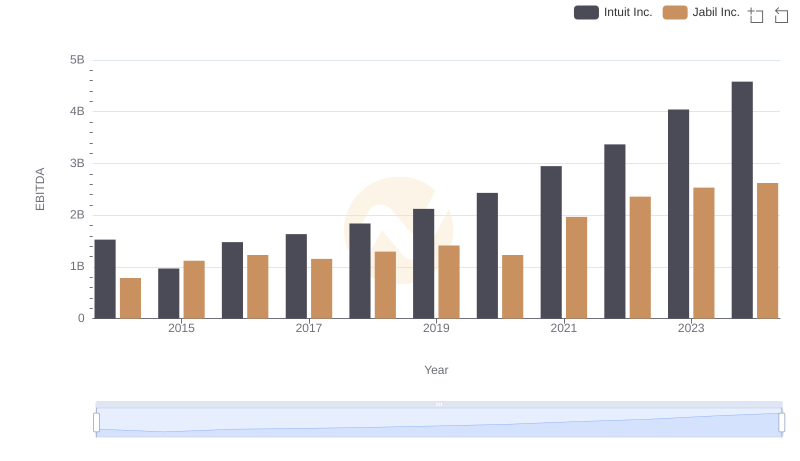
Comprehensive EBITDA Comparison: Intuit Inc. vs Jabil Inc.