| __timestamp | Intuit Inc. | Super Micro Computer, Inc. |
|---|---|---|
| Wednesday, January 1, 2014 | 1528000000 | 86715000 |
| Thursday, January 1, 2015 | 970000000 | 154994000 |
| Friday, January 1, 2016 | 1480000000 | 120773000 |
| Sunday, January 1, 2017 | 1634000000 | 111232000 |
| Monday, January 1, 2018 | 1839000000 | 115787000 |
| Tuesday, January 1, 2019 | 2121000000 | 120415000 |
| Wednesday, January 1, 2020 | 2430000000 | 114126000 |
| Friday, January 1, 2021 | 2948000000 | 152132000 |
| Saturday, January 1, 2022 | 3369000000 | 335167000 |
| Sunday, January 1, 2023 | 4043000000 | 796046000 |
| Monday, January 1, 2024 | 4581000000 | 1288409000 |
Unleashing the power of data
In the ever-evolving landscape of technology, financial performance is a key indicator of a company's resilience and growth. Over the past decade, Intuit Inc. has demonstrated a remarkable trajectory in its EBITDA, growing by approximately 200% from 2014 to 2024. This growth reflects Intuit's strategic innovations and market adaptability. In contrast, Super Micro Computer, Inc. has shown a more modest yet significant increase of around 1,400% in the same period, highlighting its emerging presence in the tech industry.
While Intuit's EBITDA surged from 1.5 billion in 2014 to an impressive 4.6 billion in 2024, Super Micro Computer, Inc. expanded from a humble 87 million to 1.3 billion. This side-by-side analysis underscores the diverse growth strategies and market positions of these two tech giants, offering valuable insights for investors and industry enthusiasts alike.
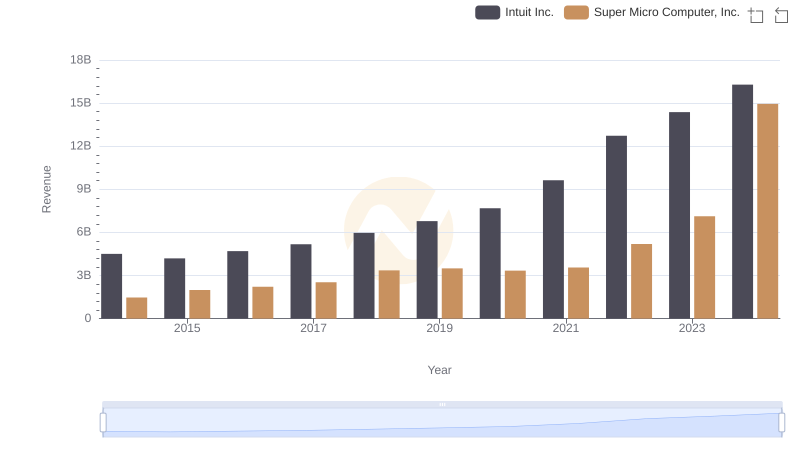
Breaking Down Revenue Trends: Intuit Inc. vs Super Micro Computer, Inc.
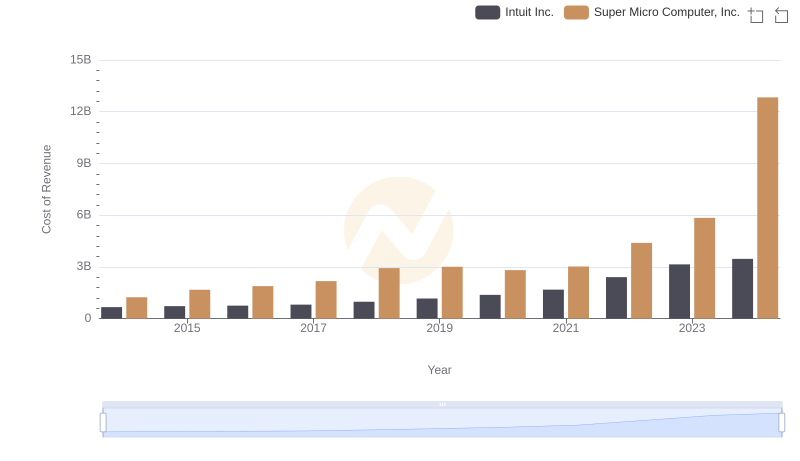
Cost of Revenue: Key Insights for Intuit Inc. and Super Micro Computer, Inc.
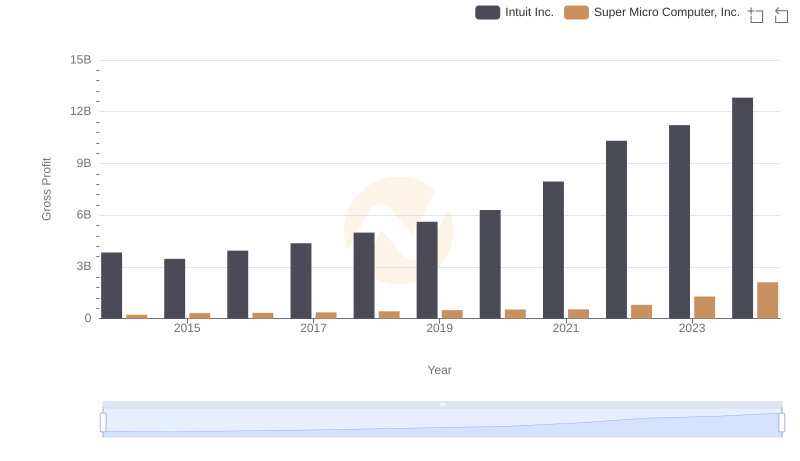
Gross Profit Analysis: Comparing Intuit Inc. and Super Micro Computer, Inc.
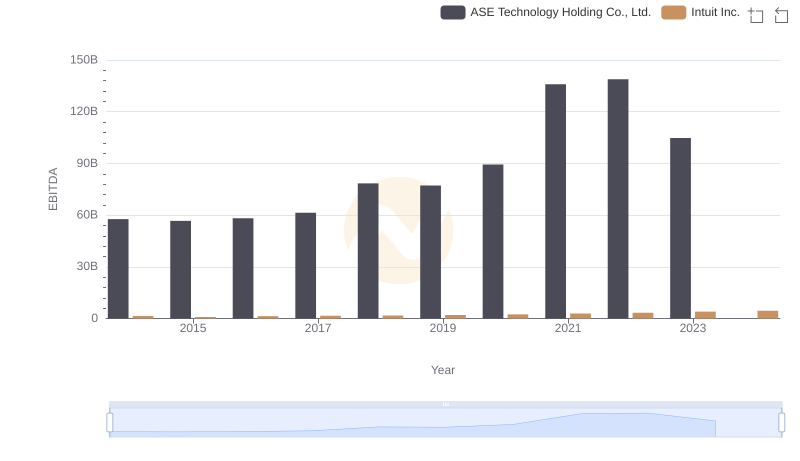
EBITDA Metrics Evaluated: Intuit Inc. vs ASE Technology Holding Co., Ltd.
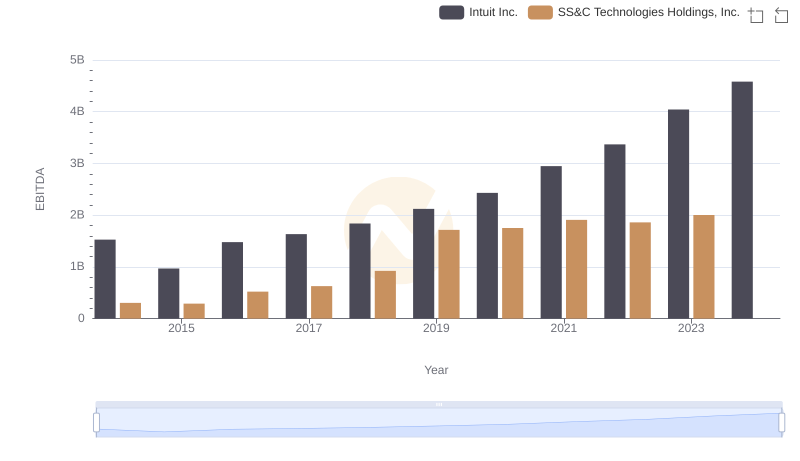
EBITDA Performance Review: Intuit Inc. vs SS&C Technologies Holdings, Inc.
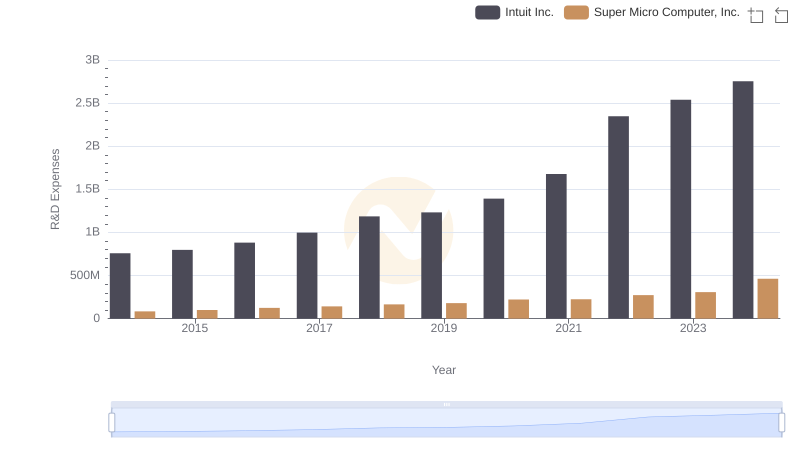
Intuit Inc. or Super Micro Computer, Inc.: Who Invests More in Innovation?
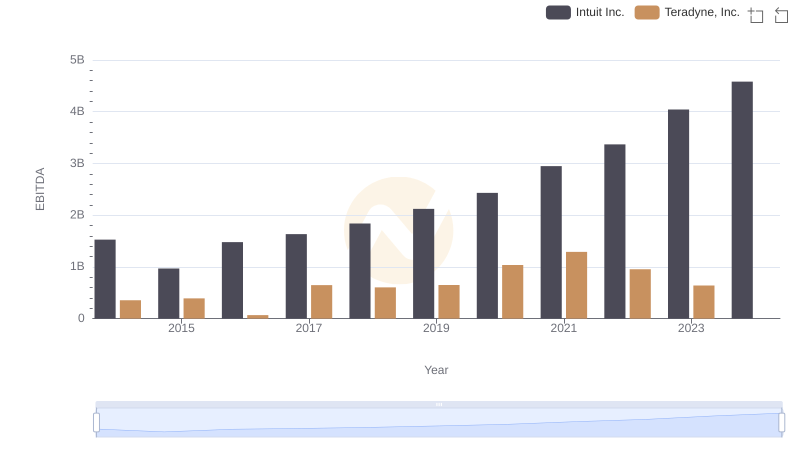
A Side-by-Side Analysis of EBITDA: Intuit Inc. and Teradyne, Inc.
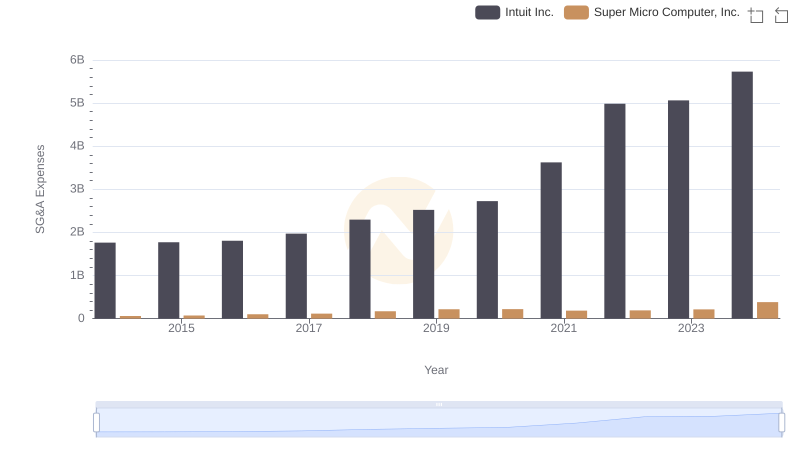
Operational Costs Compared: SG&A Analysis of Intuit Inc. and Super Micro Computer, Inc.
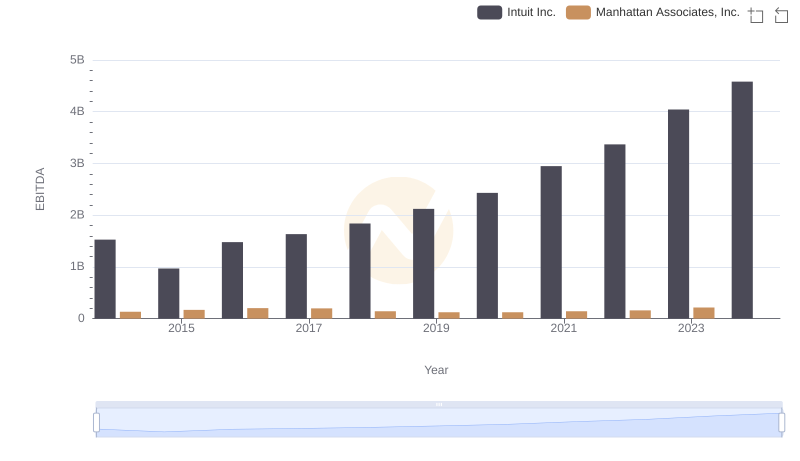
Comprehensive EBITDA Comparison: Intuit Inc. vs Manhattan Associates, Inc.
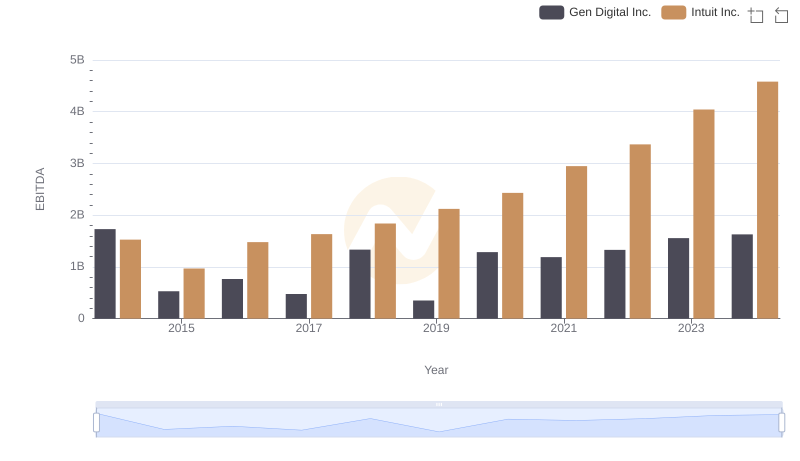
EBITDA Metrics Evaluated: Intuit Inc. vs Gen Digital Inc.
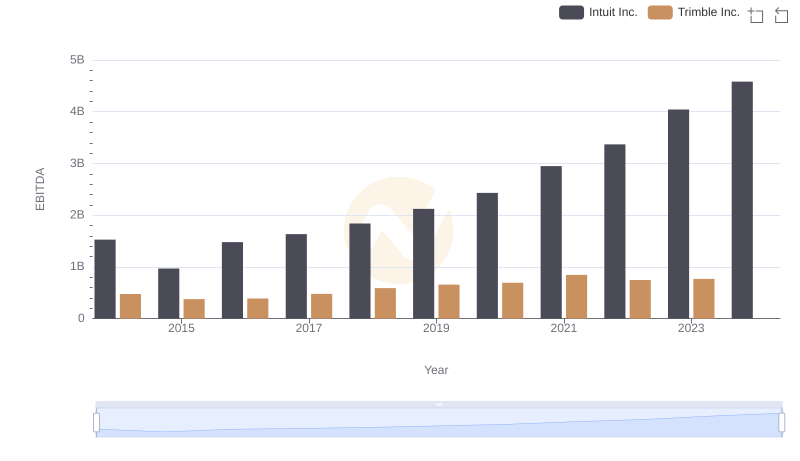
Comparative EBITDA Analysis: Intuit Inc. vs Trimble Inc.
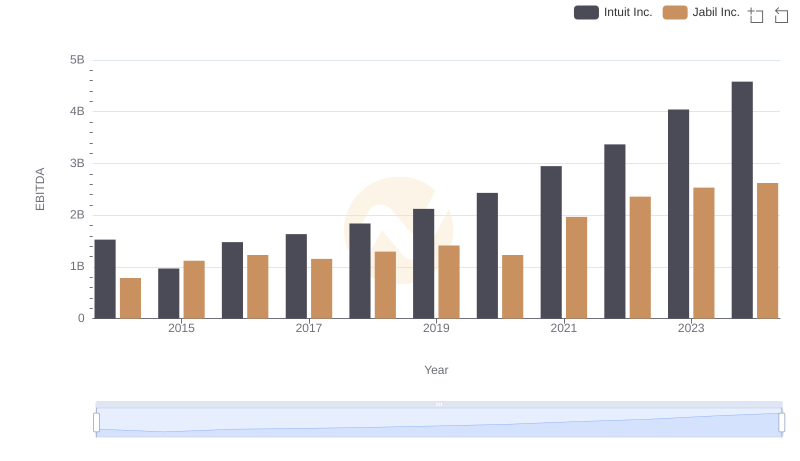
Comprehensive EBITDA Comparison: Intuit Inc. vs Jabil Inc.