| __timestamp | Intuit Inc. | Zebra Technologies Corporation |
|---|---|---|
| Wednesday, January 1, 2014 | 1528000000 | 154836000 |
| Thursday, January 1, 2015 | 970000000 | 336000000 |
| Friday, January 1, 2016 | 1480000000 | 366000000 |
| Sunday, January 1, 2017 | 1634000000 | 580000000 |
| Monday, January 1, 2018 | 1839000000 | 798000000 |
| Tuesday, January 1, 2019 | 2121000000 | 843000000 |
| Wednesday, January 1, 2020 | 2430000000 | 736000000 |
| Friday, January 1, 2021 | 2948000000 | 1173000000 |
| Saturday, January 1, 2022 | 3369000000 | 1140000000 |
| Sunday, January 1, 2023 | 4043000000 | 652000000 |
| Monday, January 1, 2024 | 4581000000 | 937000000 |
Unleashing insights
In the ever-evolving landscape of technology, Intuit Inc. and Zebra Technologies Corporation have showcased distinct trajectories in their EBITDA performance from 2014 to 2023. Intuit Inc., a leader in financial software, has demonstrated a robust growth pattern, with its EBITDA surging by approximately 200% over the decade. This growth reflects Intuit's strategic innovations and market adaptability. In contrast, Zebra Technologies, known for its enterprise asset intelligence solutions, experienced a more modest EBITDA increase of around 650% from 2014 to 2021, before a notable decline in 2023. This divergence highlights the varying market dynamics and strategic decisions impacting these tech giants. As we look to 2024, Intuit's continued upward trend suggests a strong market position, while Zebra's missing data for 2024 leaves room for speculation on its future performance.
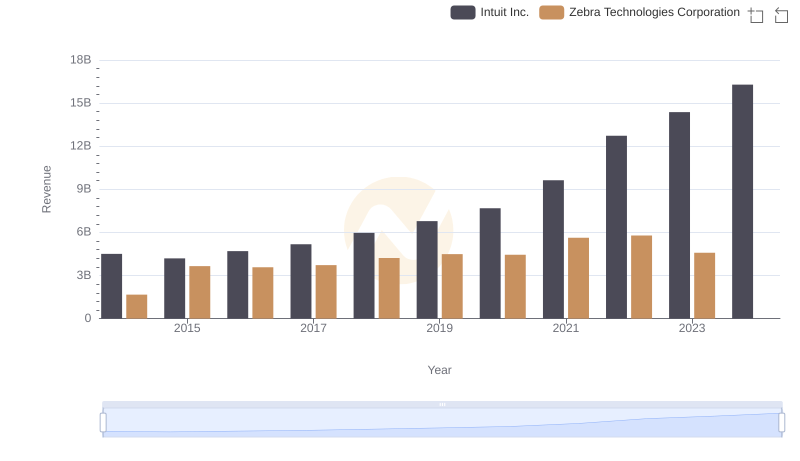
Intuit Inc. vs Zebra Technologies Corporation: Examining Key Revenue Metrics
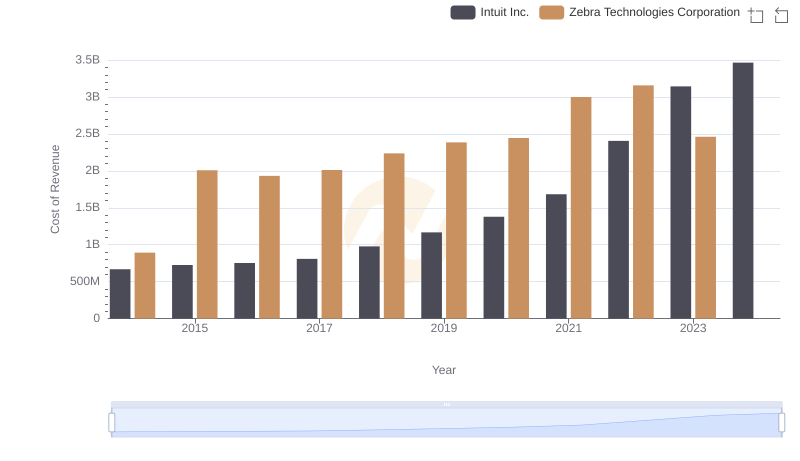
Cost of Revenue: Key Insights for Intuit Inc. and Zebra Technologies Corporation
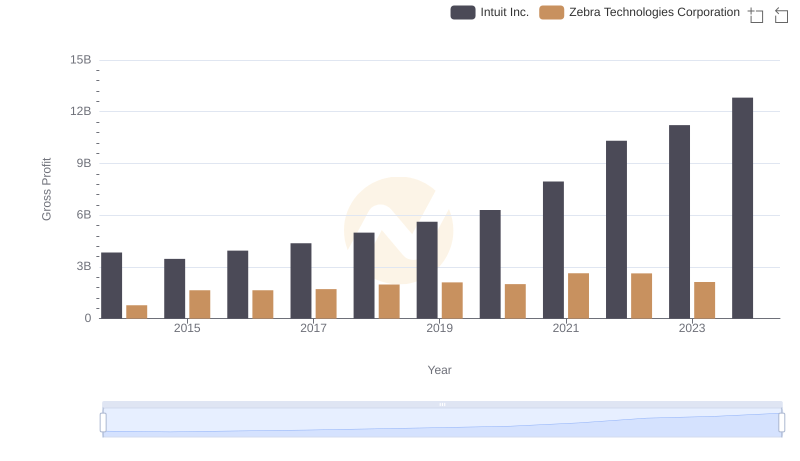
Who Generates Higher Gross Profit? Intuit Inc. or Zebra Technologies Corporation
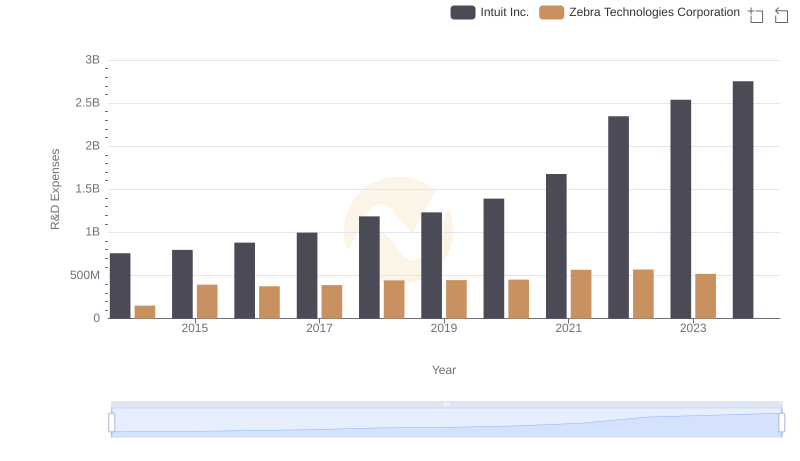
Intuit Inc. vs Zebra Technologies Corporation: Strategic Focus on R&D Spending
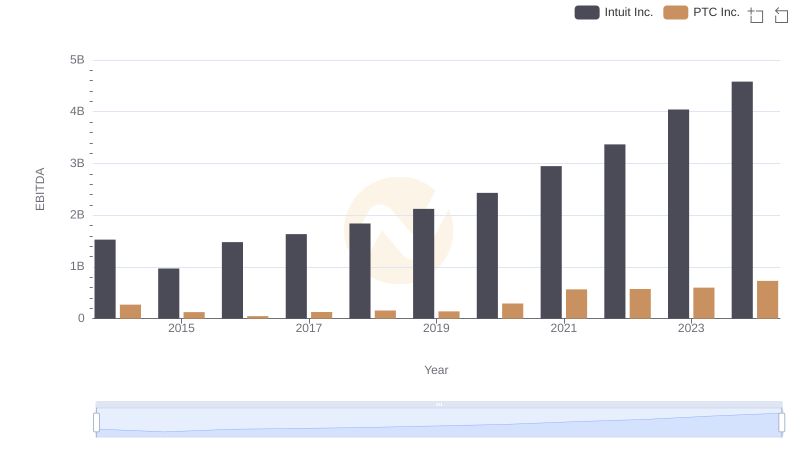
Intuit Inc. vs PTC Inc.: In-Depth EBITDA Performance Comparison
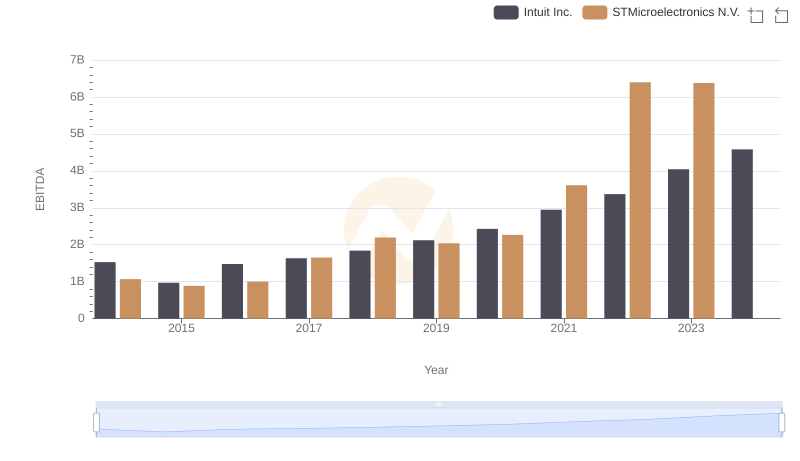
EBITDA Analysis: Evaluating Intuit Inc. Against STMicroelectronics N.V.

Operational Costs Compared: SG&A Analysis of Intuit Inc. and Zebra Technologies Corporation
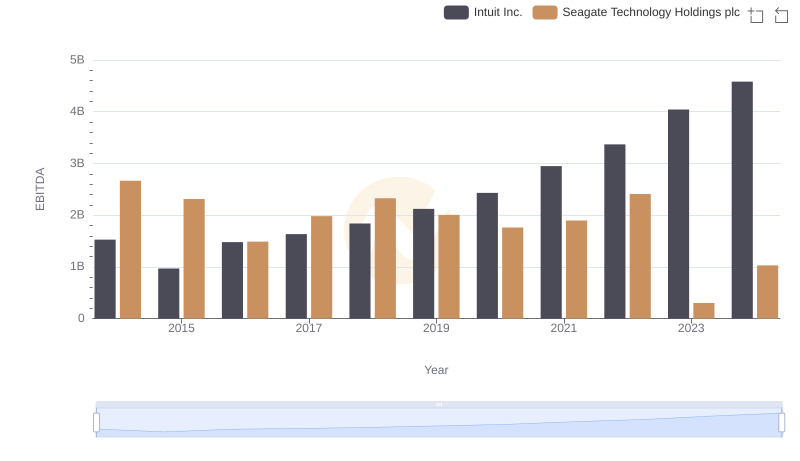
Intuit Inc. vs Seagate Technology Holdings plc: In-Depth EBITDA Performance Comparison
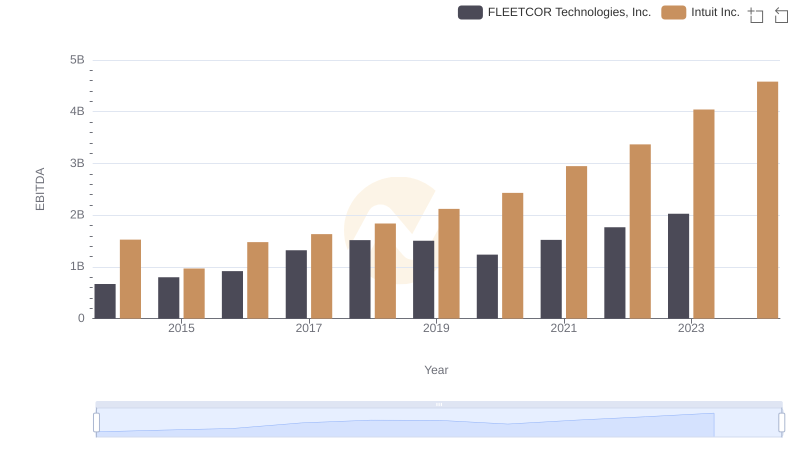
Professional EBITDA Benchmarking: Intuit Inc. vs FLEETCOR Technologies, Inc.
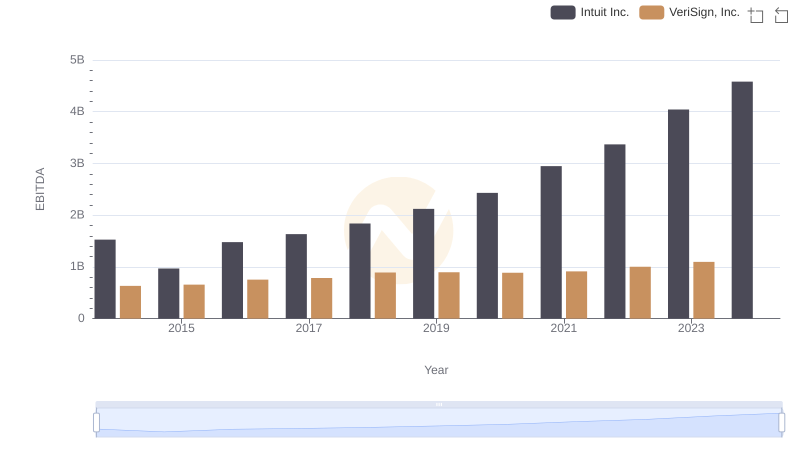
Professional EBITDA Benchmarking: Intuit Inc. vs VeriSign, Inc.
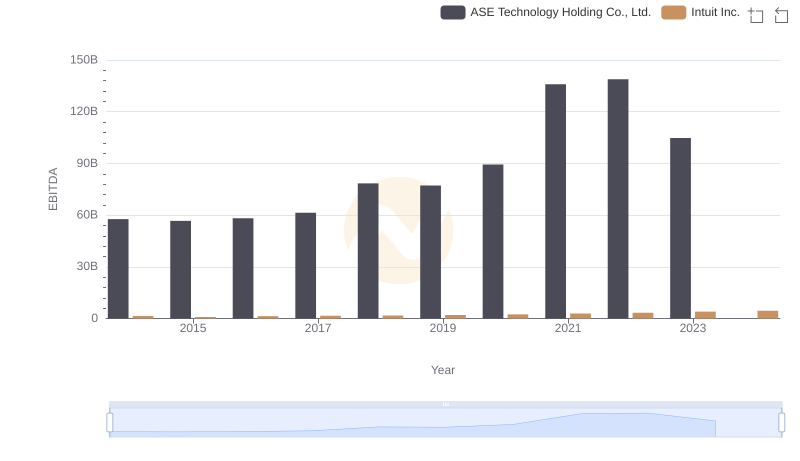
EBITDA Metrics Evaluated: Intuit Inc. vs ASE Technology Holding Co., Ltd.
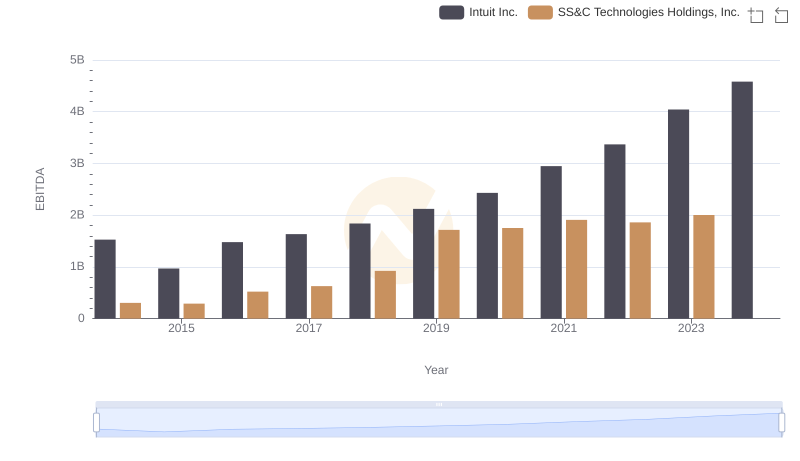
EBITDA Performance Review: Intuit Inc. vs SS&C Technologies Holdings, Inc.