| __timestamp | Gen Digital Inc. | Intuit Inc. |
|---|---|---|
| Wednesday, January 1, 2014 | 1731000000 | 1528000000 |
| Thursday, January 1, 2015 | 530000000 | 970000000 |
| Friday, January 1, 2016 | 766000000 | 1480000000 |
| Sunday, January 1, 2017 | 476000000 | 1634000000 |
| Monday, January 1, 2018 | 1333000000 | 1839000000 |
| Tuesday, January 1, 2019 | 350000000 | 2121000000 |
| Wednesday, January 1, 2020 | 1286000000 | 2430000000 |
| Friday, January 1, 2021 | 1188000000 | 2948000000 |
| Saturday, January 1, 2022 | 1328000000 | 3369000000 |
| Sunday, January 1, 2023 | 1557000000 | 4043000000 |
| Monday, January 1, 2024 | 1629000000 | 4581000000 |
Unleashing the power of data
In the ever-evolving landscape of financial technology, Intuit Inc. and Gen Digital Inc. have emerged as formidable players. Over the past decade, from 2014 to 2024, these companies have demonstrated significant growth in their EBITDA, a key indicator of financial health and operational efficiency.
Intuit Inc. has shown a remarkable upward trajectory, with its EBITDA growing by approximately 200% over this period. Starting at a modest level in 2014, Intuit's EBITDA surged to over four times its initial value by 2024, reflecting its strategic expansions and innovations.
Meanwhile, Gen Digital Inc. experienced a more volatile journey. Despite fluctuations, it managed to achieve a 6% increase in EBITDA from 2014 to 2024. This growth underscores its resilience and adaptability in a competitive market.
These insights highlight the dynamic nature of the tech industry and the importance of strategic financial management.
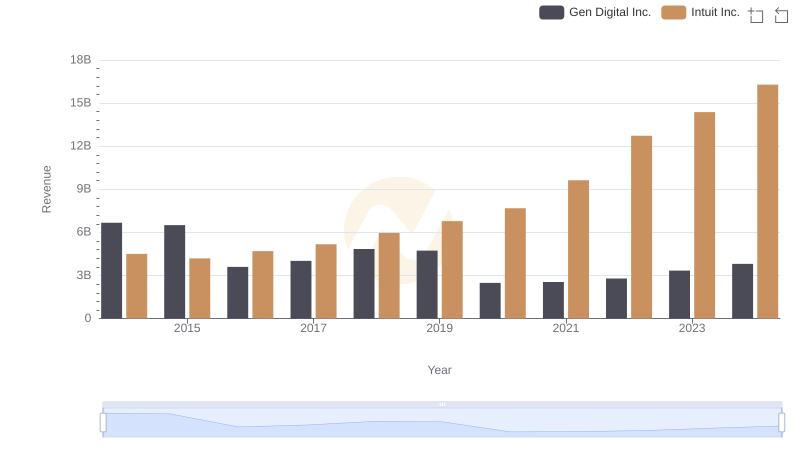
Intuit Inc. or Gen Digital Inc.: Who Leads in Yearly Revenue?
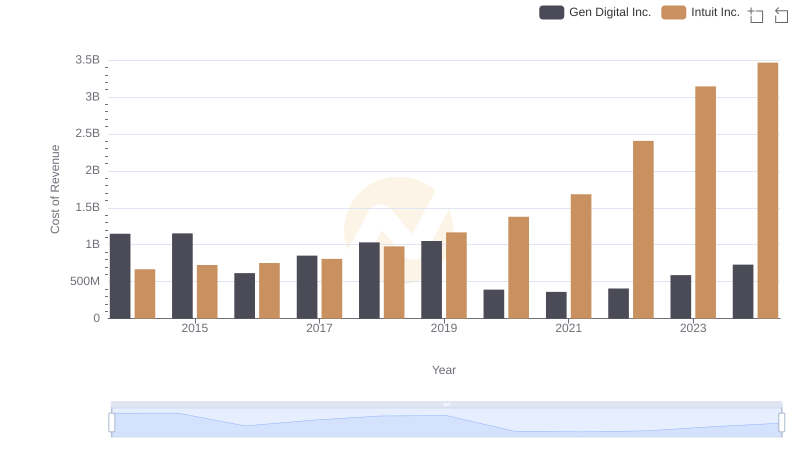
Comparing Cost of Revenue Efficiency: Intuit Inc. vs Gen Digital Inc.
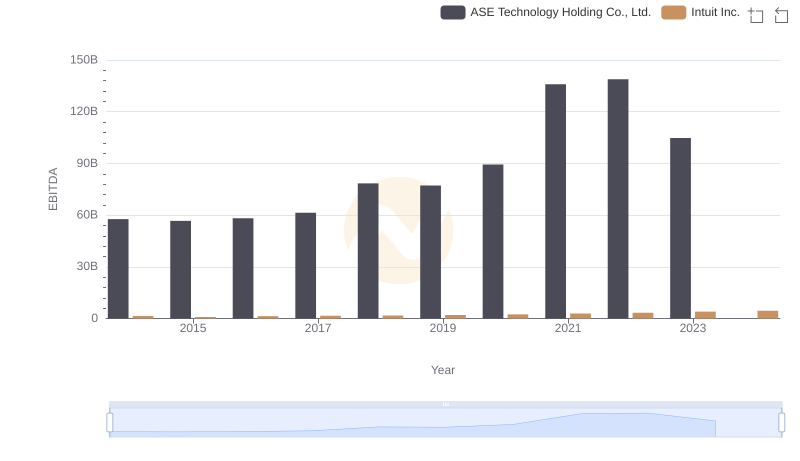
EBITDA Metrics Evaluated: Intuit Inc. vs ASE Technology Holding Co., Ltd.
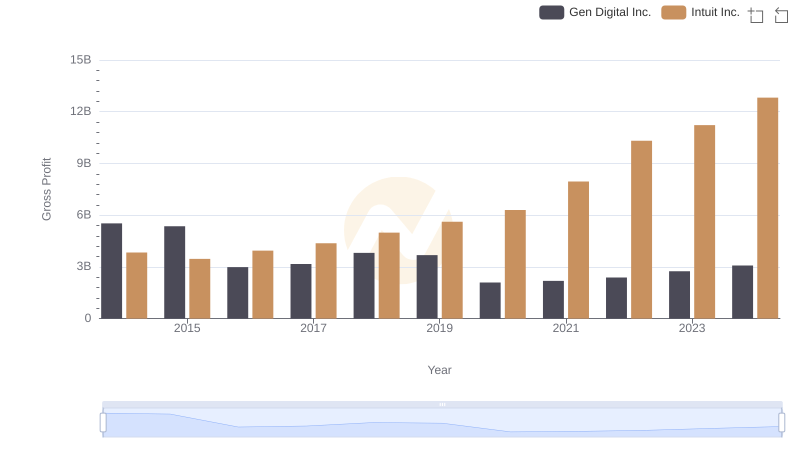
Intuit Inc. vs Gen Digital Inc.: A Gross Profit Performance Breakdown
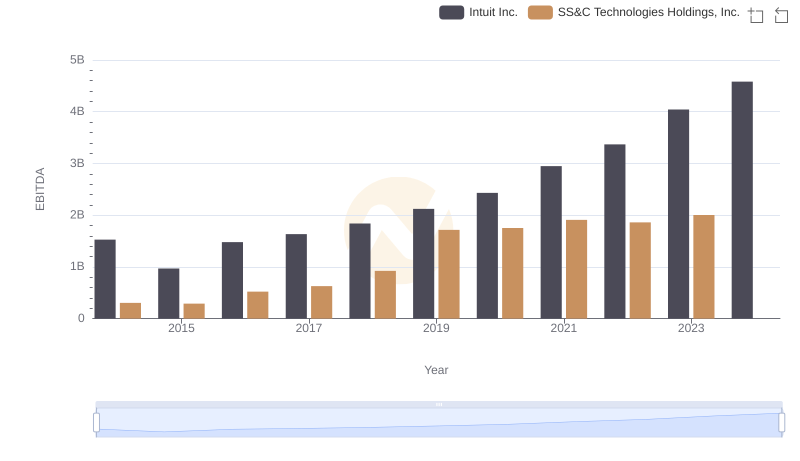
EBITDA Performance Review: Intuit Inc. vs SS&C Technologies Holdings, Inc.
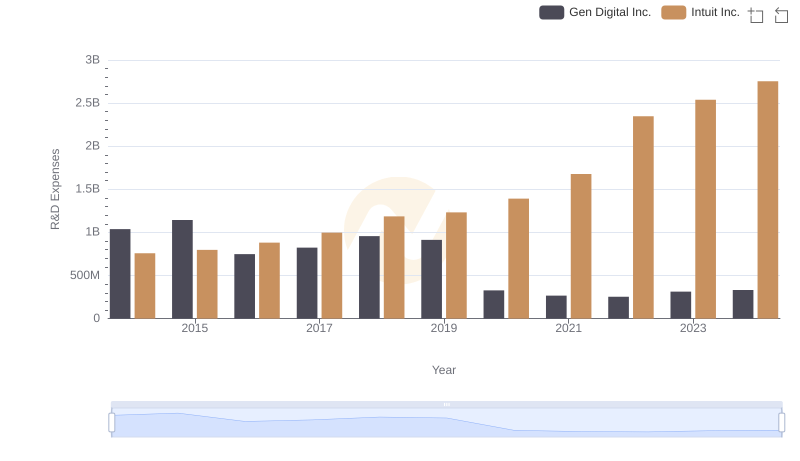
Research and Development Investment: Intuit Inc. vs Gen Digital Inc.
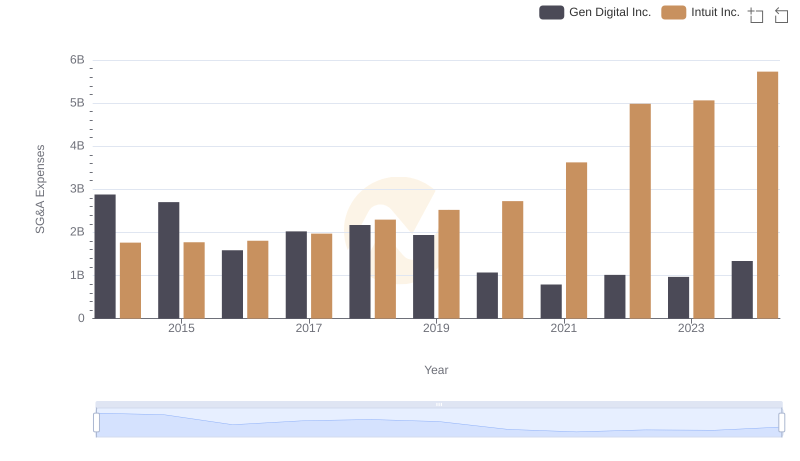
Breaking Down SG&A Expenses: Intuit Inc. vs Gen Digital Inc.
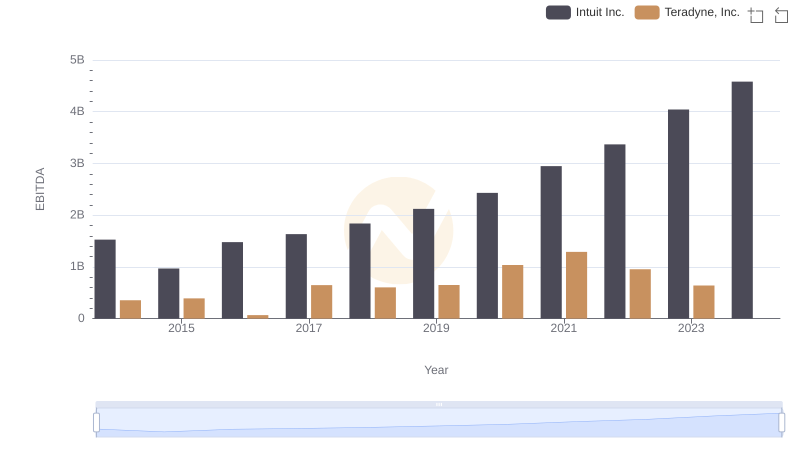
A Side-by-Side Analysis of EBITDA: Intuit Inc. and Teradyne, Inc.
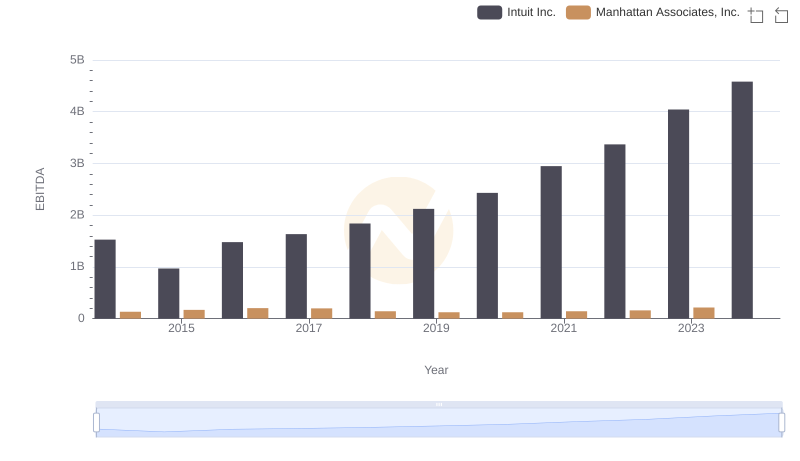
Comprehensive EBITDA Comparison: Intuit Inc. vs Manhattan Associates, Inc.
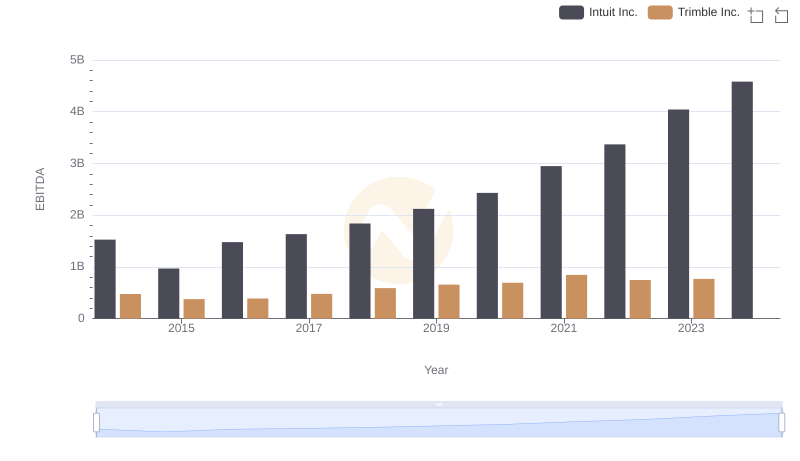
Comparative EBITDA Analysis: Intuit Inc. vs Trimble Inc.
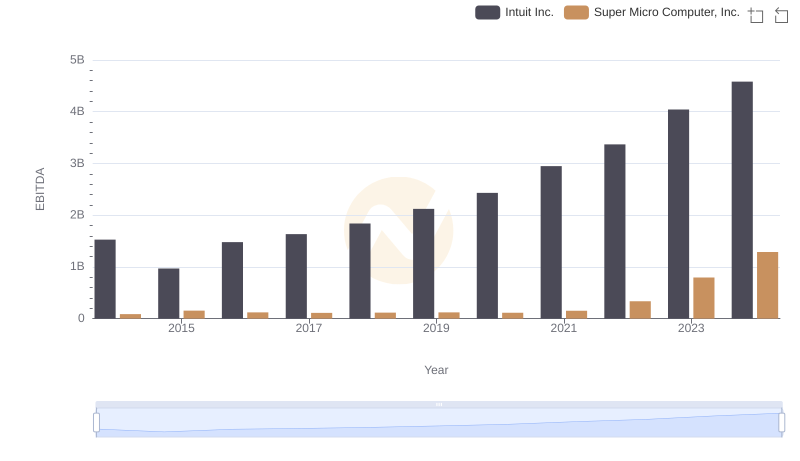
A Side-by-Side Analysis of EBITDA: Intuit Inc. and Super Micro Computer, Inc.
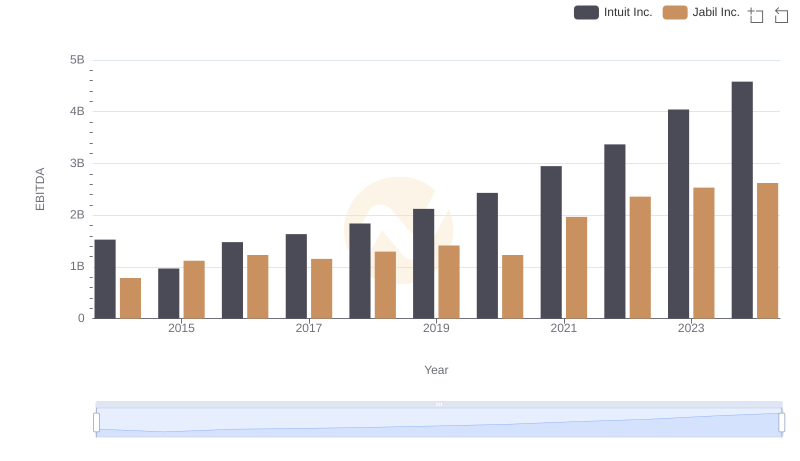
Comprehensive EBITDA Comparison: Intuit Inc. vs Jabil Inc.