| __timestamp | Cisco Systems, Inc. | Fortive Corporation |
|---|---|---|
| Wednesday, January 1, 2014 | 12709000000 | 1389400000 |
| Thursday, January 1, 2015 | 14209000000 | 1446600000 |
| Friday, January 1, 2016 | 15678000000 | 1422400000 |
| Sunday, January 1, 2017 | 15383000000 | 1301300000 |
| Monday, January 1, 2018 | 16172000000 | 1436200000 |
| Tuesday, January 1, 2019 | 17334000000 | 936100000 |
| Wednesday, January 1, 2020 | 16363000000 | 947800000 |
| Friday, January 1, 2021 | 15558000000 | 1206100000 |
| Saturday, January 1, 2022 | 16794000000 | 1471300000 |
| Sunday, January 1, 2023 | 17471000000 | 1571100000 |
| Monday, January 1, 2024 | 15747000000 | 1206600000 |
Unveiling the hidden dimensions of data
In the ever-evolving tech landscape, Cisco Systems, Inc. and Fortive Corporation have been pivotal players. Over the past decade, Cisco's EBITDA has shown a robust upward trend, peaking in 2023 with a 37% increase from 2014. This growth underscores Cisco's strategic adaptability and market resilience. In contrast, Fortive's EBITDA journey has been more volatile, with a notable dip in 2019, but a commendable recovery by 2023, marking a 13% rise from its 2014 figures. The data reveals Cisco's consistent dominance, with EBITDA figures consistently surpassing Fortive's by over 90% annually. However, Fortive's recent growth trajectory suggests a promising future. The absence of 2024 data for Fortive leaves room for speculation, highlighting the dynamic nature of the industry. This comparison not only reflects financial health but also strategic foresight in navigating market challenges.
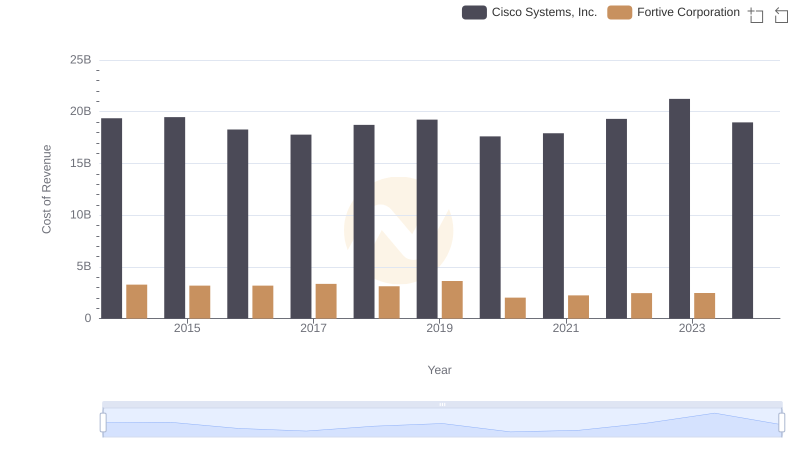
Comparing Cost of Revenue Efficiency: Cisco Systems, Inc. vs Fortive Corporation
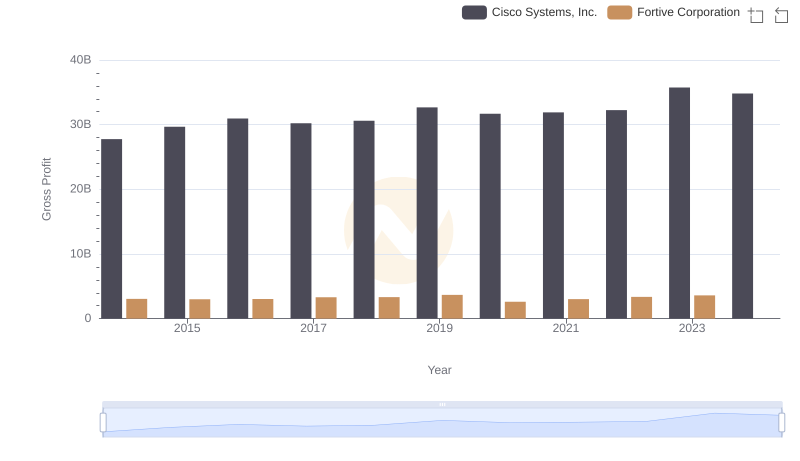
Key Insights on Gross Profit: Cisco Systems, Inc. vs Fortive Corporation
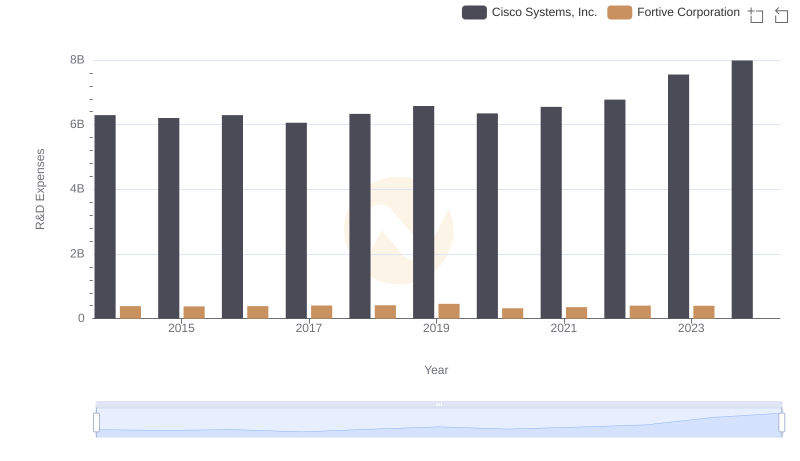
Who Prioritizes Innovation? R&D Spending Compared for Cisco Systems, Inc. and Fortive Corporation

EBITDA Performance Review: Cisco Systems, Inc. vs II-VI Incorporated
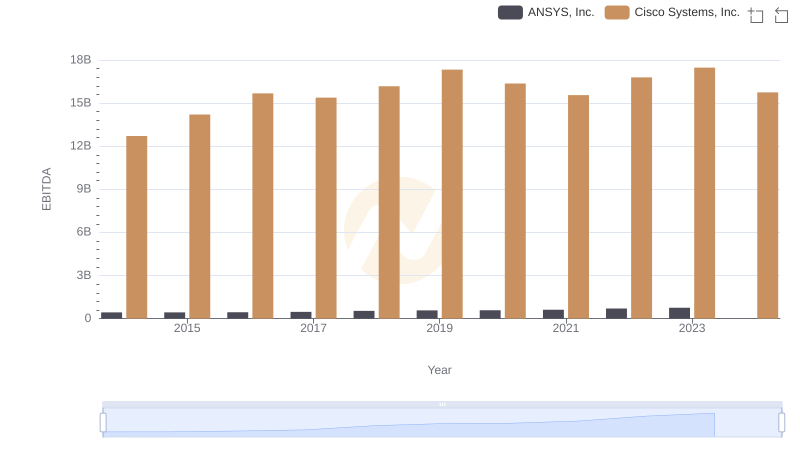
A Side-by-Side Analysis of EBITDA: Cisco Systems, Inc. and ANSYS, Inc.
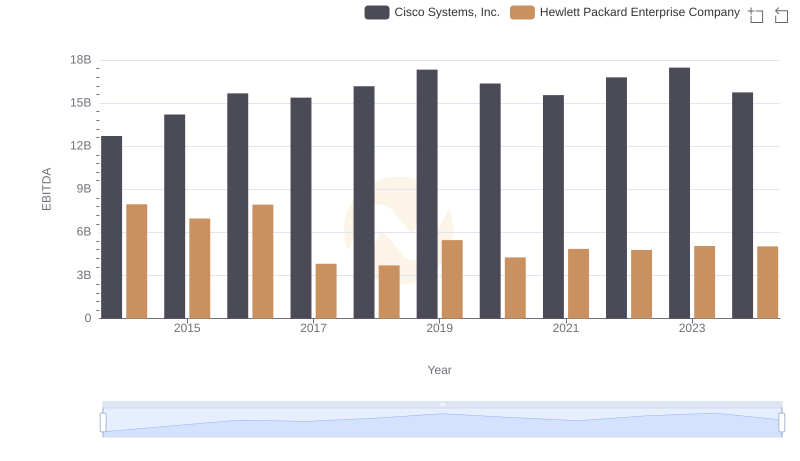
Comparative EBITDA Analysis: Cisco Systems, Inc. vs Hewlett Packard Enterprise Company
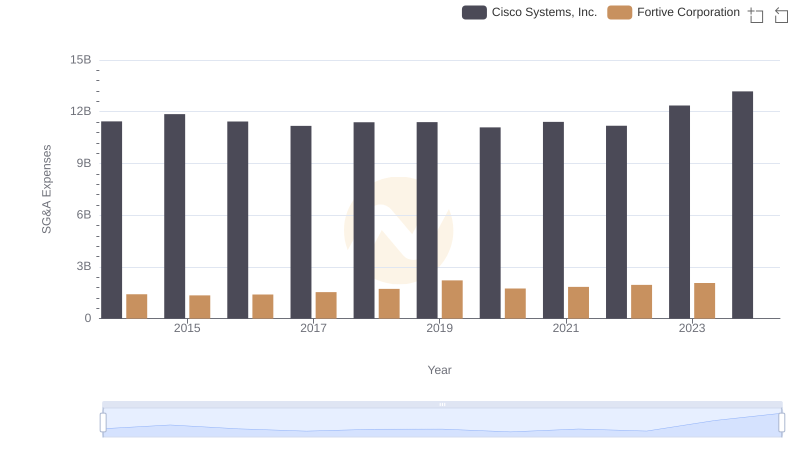
Operational Costs Compared: SG&A Analysis of Cisco Systems, Inc. and Fortive Corporation
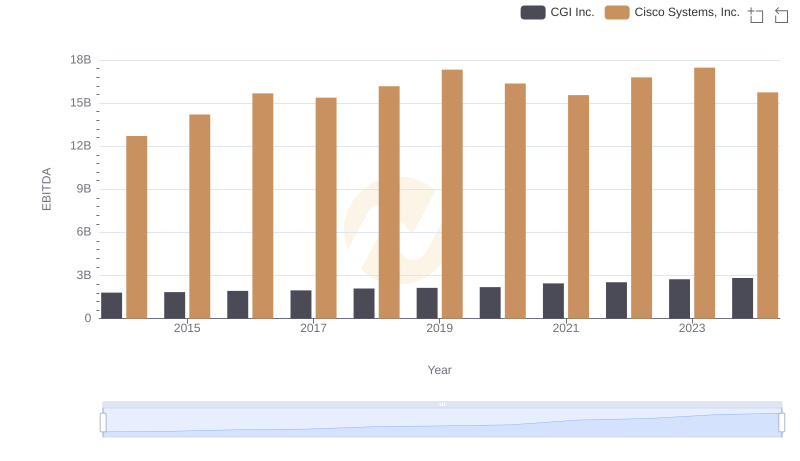
EBITDA Analysis: Evaluating Cisco Systems, Inc. Against CGI Inc.
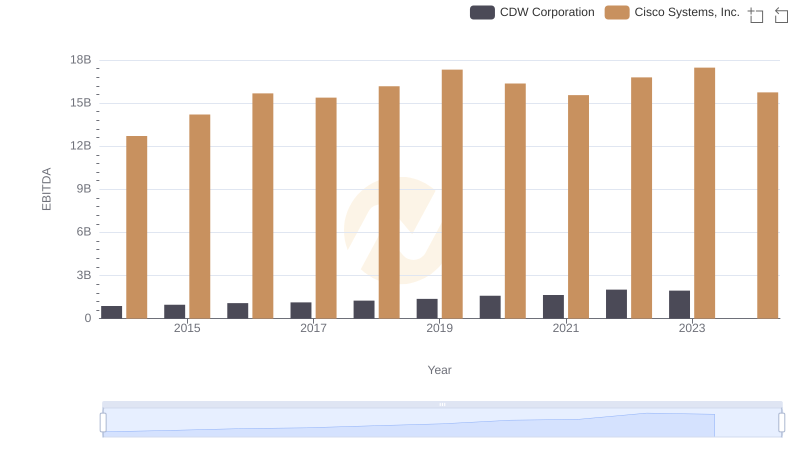
A Side-by-Side Analysis of EBITDA: Cisco Systems, Inc. and CDW Corporation
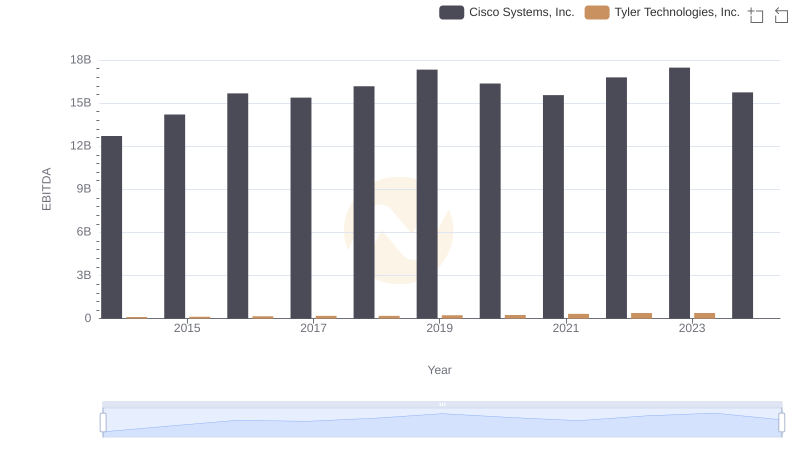
EBITDA Performance Review: Cisco Systems, Inc. vs Tyler Technologies, Inc.
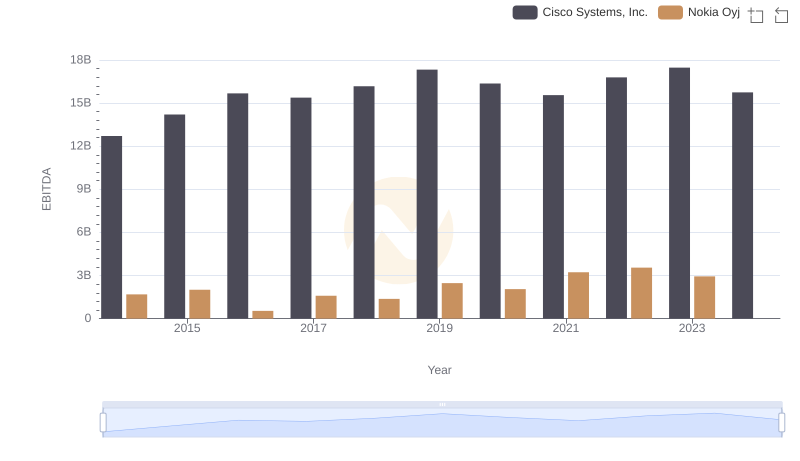
Professional EBITDA Benchmarking: Cisco Systems, Inc. vs Nokia Oyj