| __timestamp | Cisco Systems, Inc. | Hewlett Packard Enterprise Company |
|---|---|---|
| Wednesday, January 1, 2014 | 12709000000 | 7961000000 |
| Thursday, January 1, 2015 | 14209000000 | 6964000000 |
| Friday, January 1, 2016 | 15678000000 | 7933000000 |
| Sunday, January 1, 2017 | 15383000000 | 3820000000 |
| Monday, January 1, 2018 | 16172000000 | 3709000000 |
| Tuesday, January 1, 2019 | 17334000000 | 5459000000 |
| Wednesday, January 1, 2020 | 16363000000 | 4263000000 |
| Friday, January 1, 2021 | 15558000000 | 4853000000 |
| Saturday, January 1, 2022 | 16794000000 | 4779000000 |
| Sunday, January 1, 2023 | 17471000000 | 5058000000 |
| Monday, January 1, 2024 | 15747000000 | 5024000000 |
Unveiling the hidden dimensions of data
In the ever-evolving tech landscape, Cisco Systems, Inc. and Hewlett Packard Enterprise Company have been pivotal players. From 2014 to 2024, Cisco consistently outperformed HPE in terms of EBITDA, showcasing its robust financial health. Cisco's EBITDA grew by approximately 38% over this period, peaking in 2023. In contrast, HPE's EBITDA saw a decline of around 36% from its 2014 high, reflecting challenges in adapting to market shifts.
Cisco's strategic investments in networking and cybersecurity have paid off, while HPE's focus on enterprise solutions has faced hurdles. The data highlights Cisco's resilience and adaptability, maintaining a steady upward trend, whereas HPE's performance underscores the volatility in enterprise IT markets. As we look to the future, these trends offer insights into the strategic directions and market positions of these tech giants.
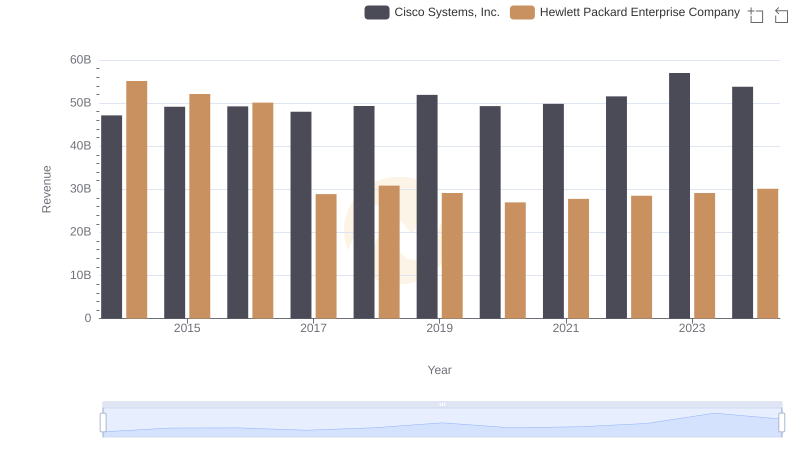
Who Generates More Revenue? Cisco Systems, Inc. or Hewlett Packard Enterprise Company
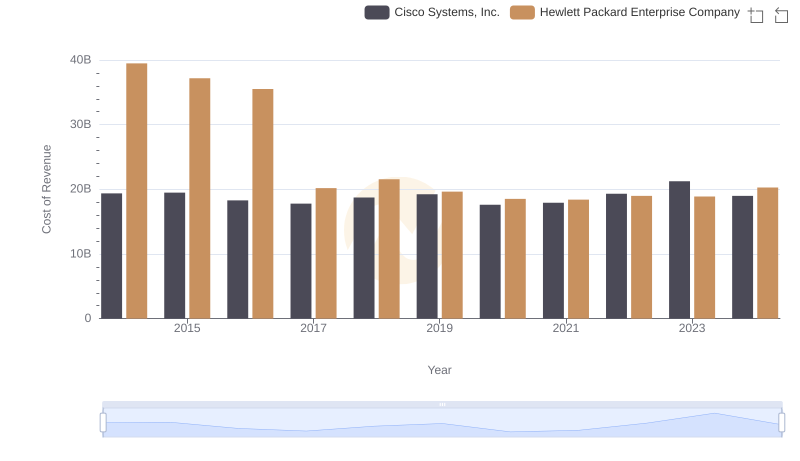
Cost of Revenue Comparison: Cisco Systems, Inc. vs Hewlett Packard Enterprise Company
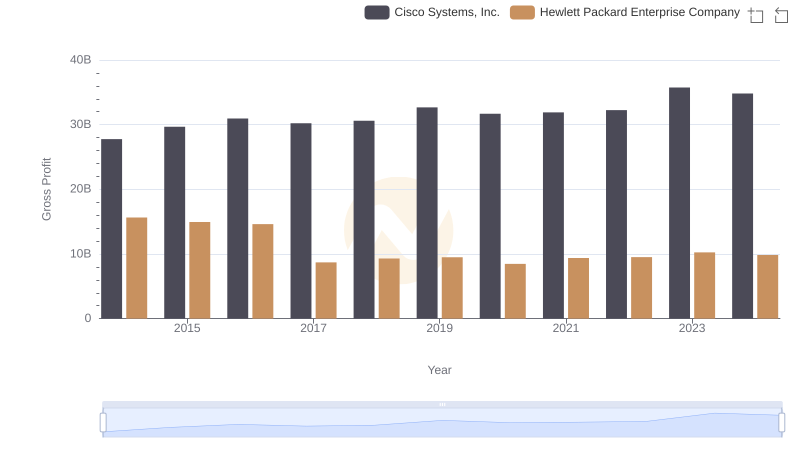
Key Insights on Gross Profit: Cisco Systems, Inc. vs Hewlett Packard Enterprise Company
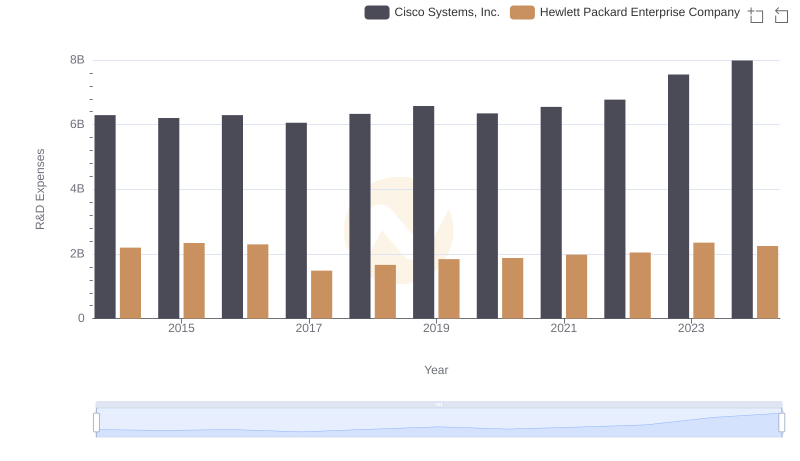
R&D Spending Showdown: Cisco Systems, Inc. vs Hewlett Packard Enterprise Company

EBITDA Metrics Evaluated: Cisco Systems, Inc. vs Monolithic Power Systems, Inc.
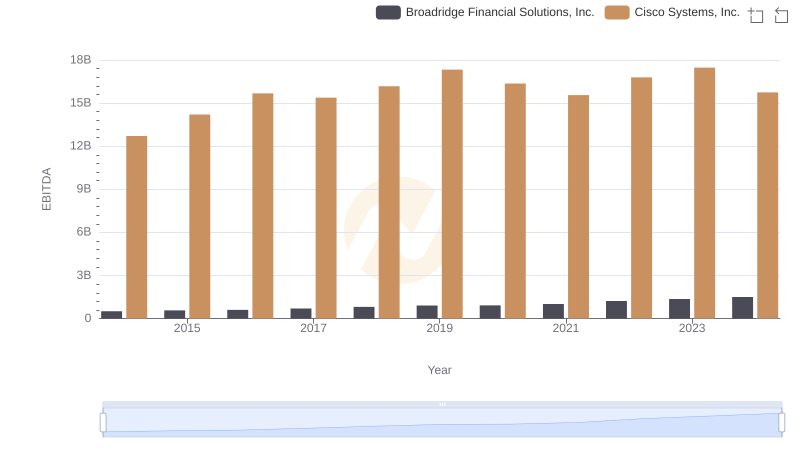
EBITDA Metrics Evaluated: Cisco Systems, Inc. vs Broadridge Financial Solutions, Inc.
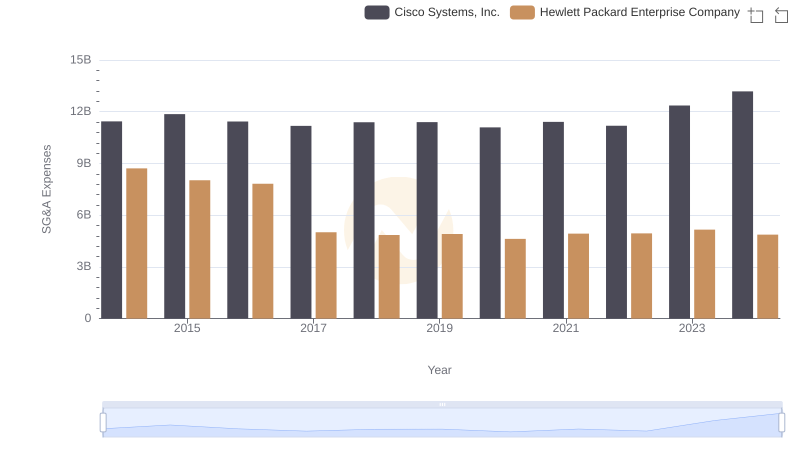
Comparing SG&A Expenses: Cisco Systems, Inc. vs Hewlett Packard Enterprise Company Trends and Insights
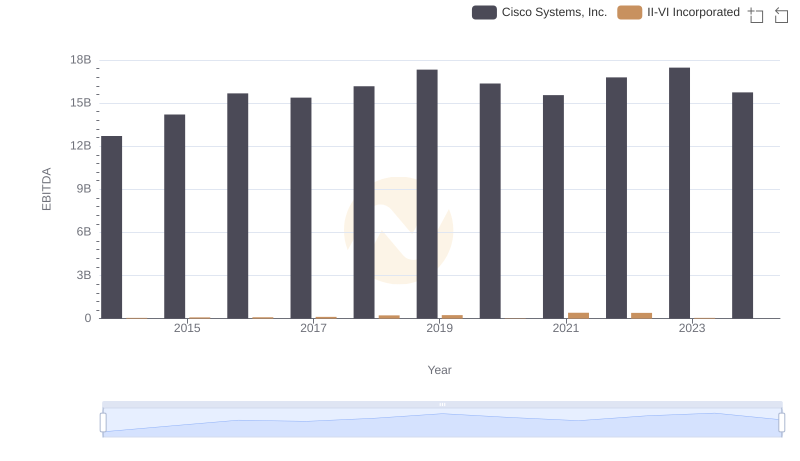
EBITDA Performance Review: Cisco Systems, Inc. vs II-VI Incorporated
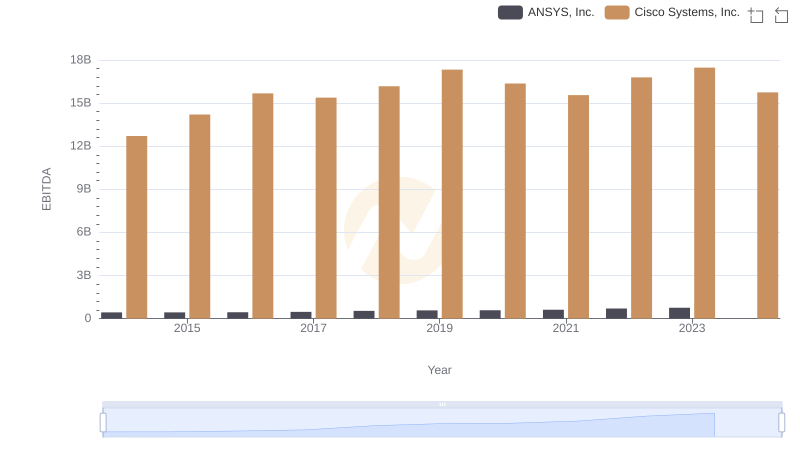
A Side-by-Side Analysis of EBITDA: Cisco Systems, Inc. and ANSYS, Inc.
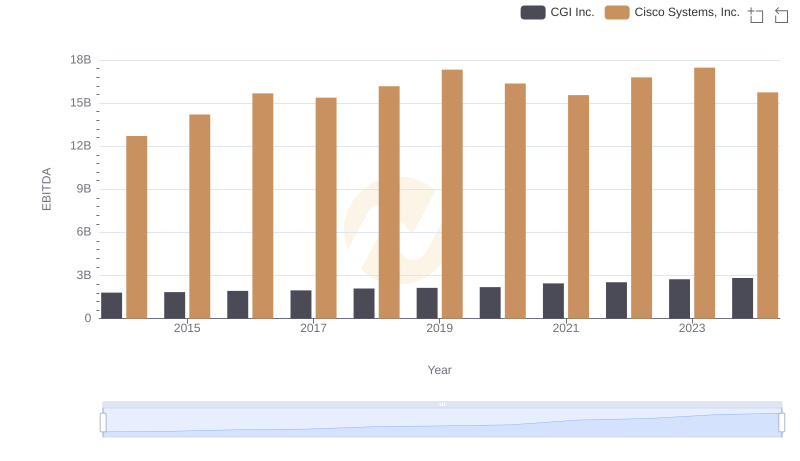
EBITDA Analysis: Evaluating Cisco Systems, Inc. Against CGI Inc.
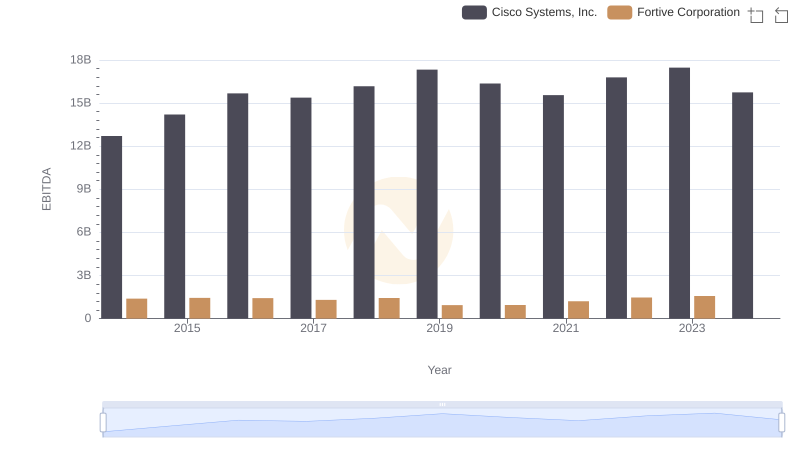
Comprehensive EBITDA Comparison: Cisco Systems, Inc. vs Fortive Corporation
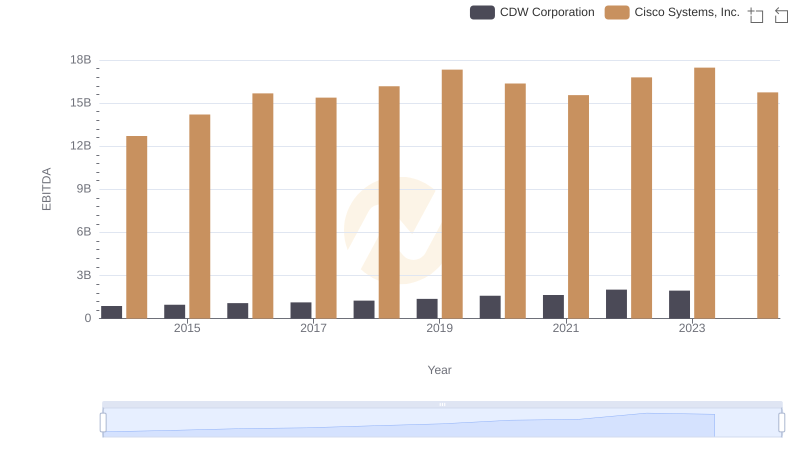
A Side-by-Side Analysis of EBITDA: Cisco Systems, Inc. and CDW Corporation