| __timestamp | Cisco Systems, Inc. | Nokia Oyj |
|---|---|---|
| Wednesday, January 1, 2014 | 12709000000 | 1689000000 |
| Thursday, January 1, 2015 | 14209000000 | 2008000000 |
| Friday, January 1, 2016 | 15678000000 | 542000000 |
| Sunday, January 1, 2017 | 15383000000 | 1590000000 |
| Monday, January 1, 2018 | 16172000000 | 1377000000 |
| Tuesday, January 1, 2019 | 17334000000 | 2474000000 |
| Wednesday, January 1, 2020 | 16363000000 | 2050000000 |
| Friday, January 1, 2021 | 15558000000 | 3227000000 |
| Saturday, January 1, 2022 | 16794000000 | 3546000000 |
| Sunday, January 1, 2023 | 17471000000 | 2944000000 |
| Monday, January 1, 2024 | 15747000000 |
Infusing magic into the data realm
In the ever-evolving tech industry, Cisco Systems, Inc. and Nokia Oyj have been pivotal players. From 2014 to 2023, Cisco consistently outperformed Nokia in EBITDA, showcasing its robust financial health. Cisco's EBITDA grew by approximately 37% over this period, peaking in 2023. In contrast, Nokia's EBITDA fluctuated, with a notable dip in 2016, but it rebounded to its highest in 2022, marking a 110% increase from its lowest point. This disparity highlights Cisco's steady growth and Nokia's volatile journey. The data for 2024 is incomplete, leaving room for speculation on future trends. As the tech landscape shifts, these insights provide a glimpse into the financial strategies and market positions of these giants. Stay tuned for more updates as we continue to track their financial trajectories.
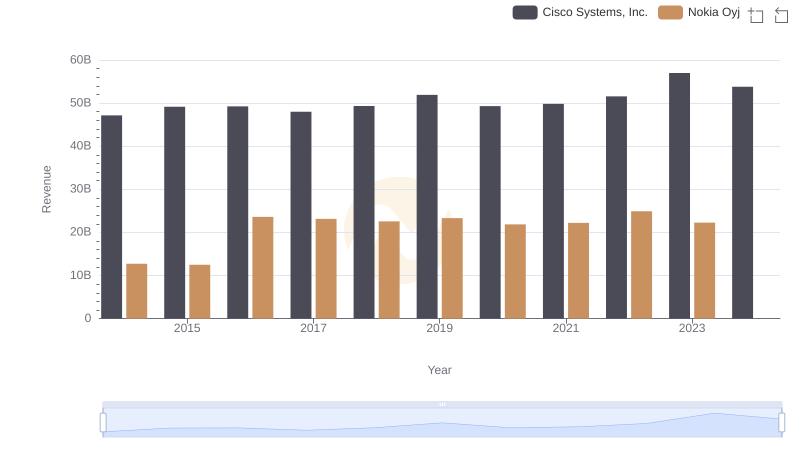
Cisco Systems, Inc. vs Nokia Oyj: Examining Key Revenue Metrics
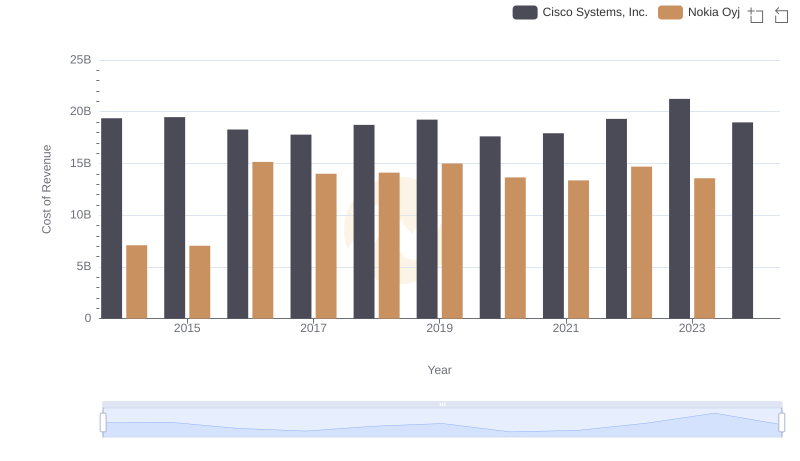
Cost Insights: Breaking Down Cisco Systems, Inc. and Nokia Oyj's Expenses
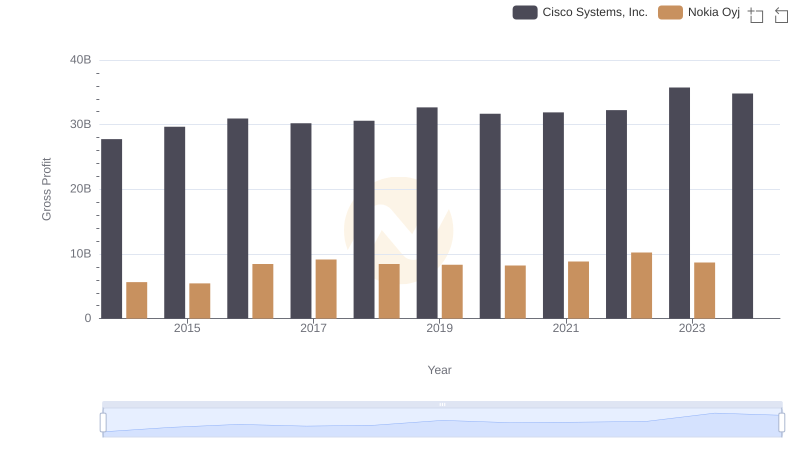
Gross Profit Comparison: Cisco Systems, Inc. and Nokia Oyj Trends
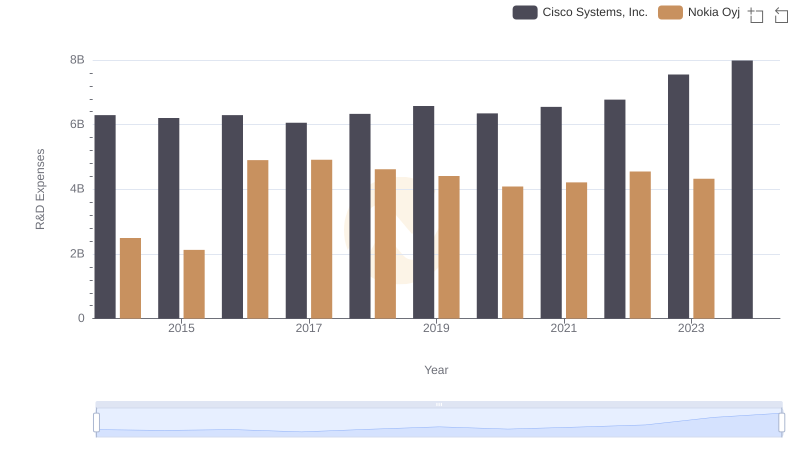
Research and Development: Comparing Key Metrics for Cisco Systems, Inc. and Nokia Oyj
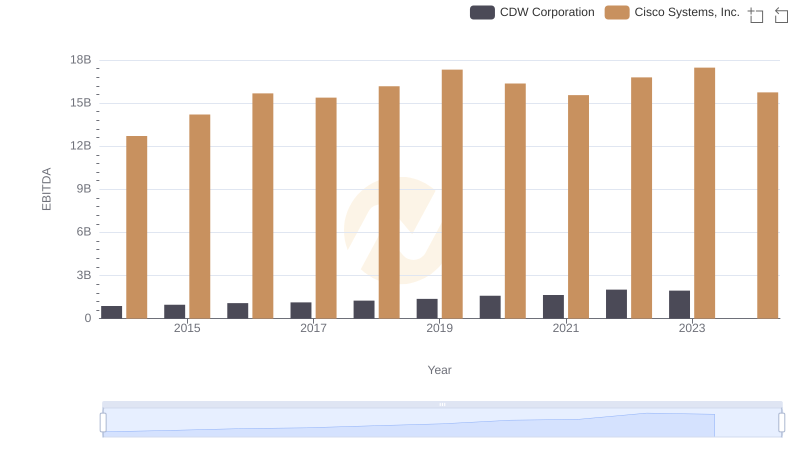
A Side-by-Side Analysis of EBITDA: Cisco Systems, Inc. and CDW Corporation
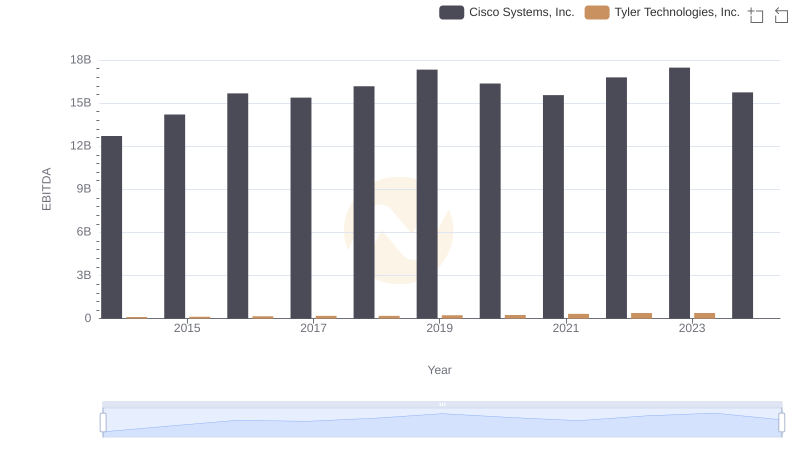
EBITDA Performance Review: Cisco Systems, Inc. vs Tyler Technologies, Inc.
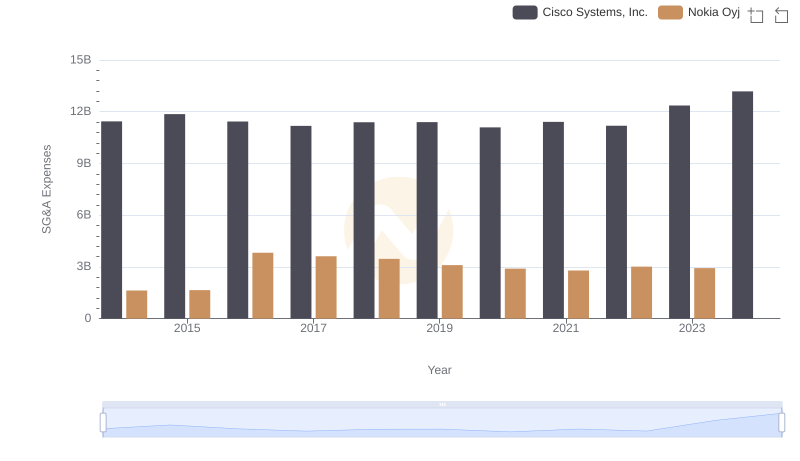
Cisco Systems, Inc. or Nokia Oyj: Who Manages SG&A Costs Better?
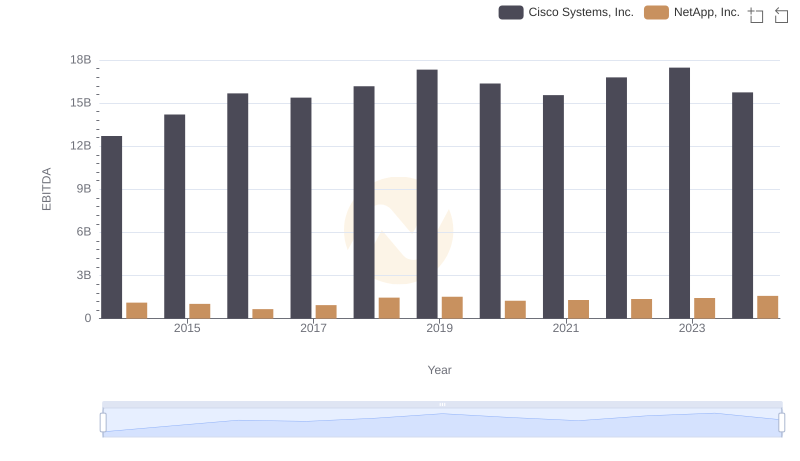
A Side-by-Side Analysis of EBITDA: Cisco Systems, Inc. and NetApp, Inc.
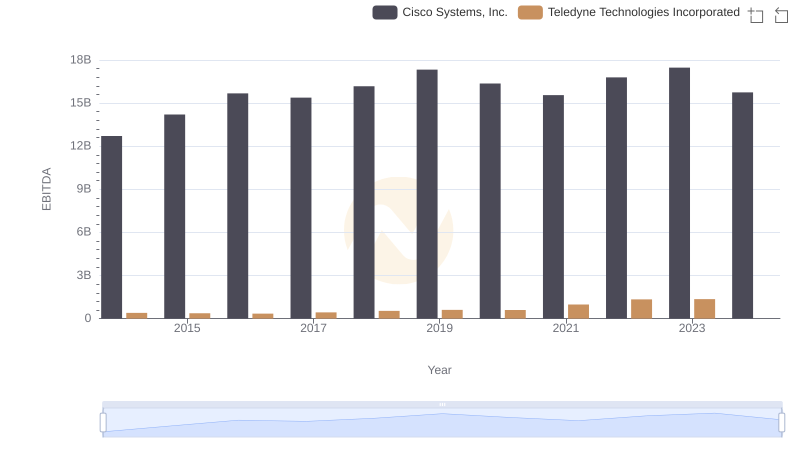
Cisco Systems, Inc. and Teledyne Technologies Incorporated: A Detailed Examination of EBITDA Performance
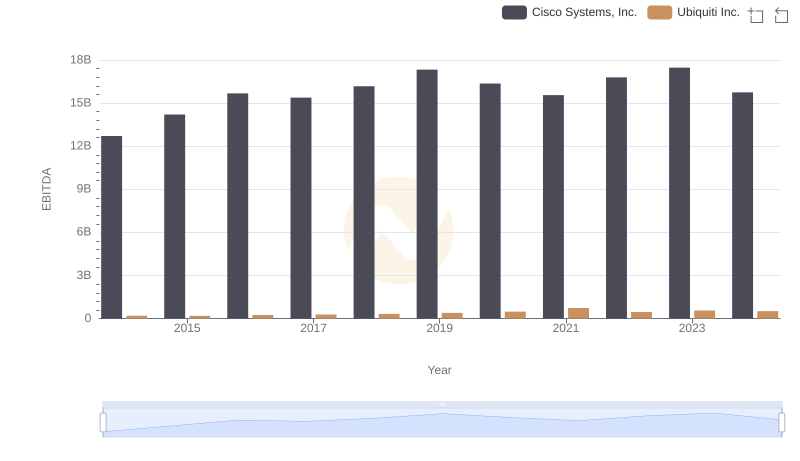
Comprehensive EBITDA Comparison: Cisco Systems, Inc. vs Ubiquiti Inc.
Professional EBITDA Benchmarking: Cisco Systems, Inc. vs ON Semiconductor Corporation
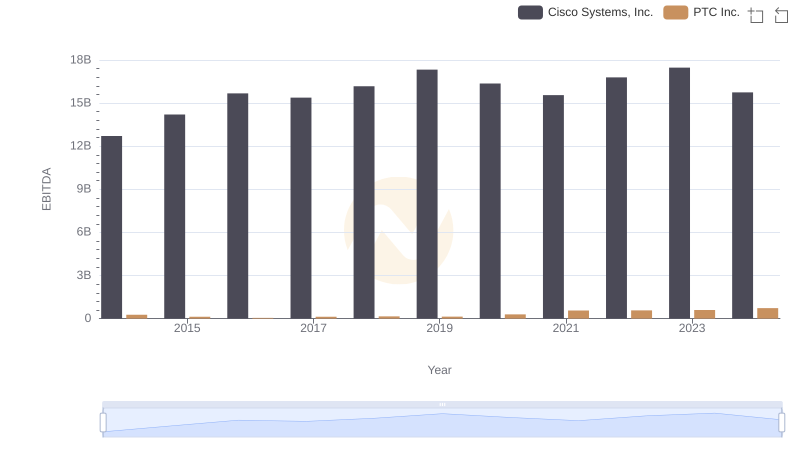
A Professional Review of EBITDA: Cisco Systems, Inc. Compared to PTC Inc.