| __timestamp | Cisco Systems, Inc. | Tyler Technologies, Inc. |
|---|---|---|
| Wednesday, January 1, 2014 | 12709000000 | 109427000 |
| Thursday, January 1, 2015 | 14209000000 | 127617000 |
| Friday, January 1, 2016 | 15678000000 | 165194000 |
| Sunday, January 1, 2017 | 15383000000 | 194467000 |
| Monday, January 1, 2018 | 16172000000 | 191279000 |
| Tuesday, January 1, 2019 | 17334000000 | 233039000 |
| Wednesday, January 1, 2020 | 16363000000 | 254583000 |
| Friday, January 1, 2021 | 15558000000 | 328119000 |
| Saturday, January 1, 2022 | 16794000000 | 388013000 |
| Sunday, January 1, 2023 | 17471000000 | 392632000 |
| Monday, January 1, 2024 | 15747000000 | 299526000 |
Igniting the spark of knowledge
In the ever-evolving tech industry, understanding financial performance is crucial. Cisco Systems, Inc. and Tyler Technologies, Inc. have shown distinct EBITDA trajectories from 2014 to 2023. Cisco, a stalwart in networking, consistently outperformed with a peak EBITDA of approximately $17.5 billion in 2023, marking a 37% increase from 2014. Meanwhile, Tyler Technologies, a leader in public sector software, demonstrated impressive growth, with EBITDA rising by 259% over the same period, reaching nearly $393 million in 2023. This stark contrast highlights Cisco's steady dominance and Tyler's rapid expansion. However, data for 2024 is incomplete, leaving room for speculation on future trends. As the tech landscape shifts, these insights offer a glimpse into the strategic maneuvers of two industry giants.
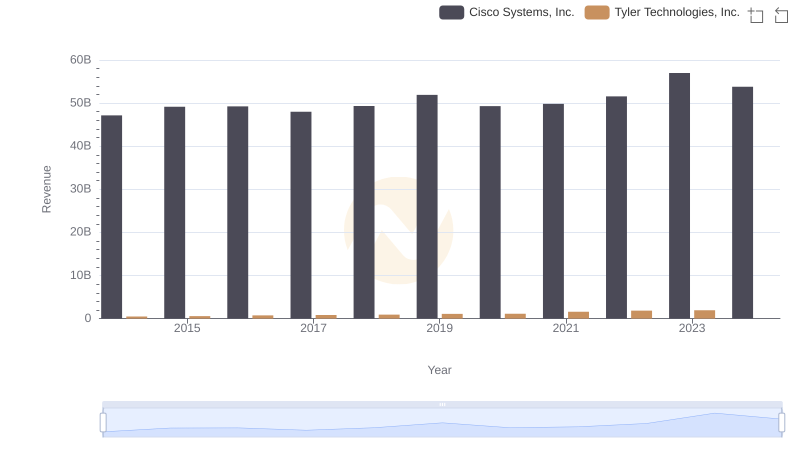
Cisco Systems, Inc. vs Tyler Technologies, Inc.: Annual Revenue Growth Compared
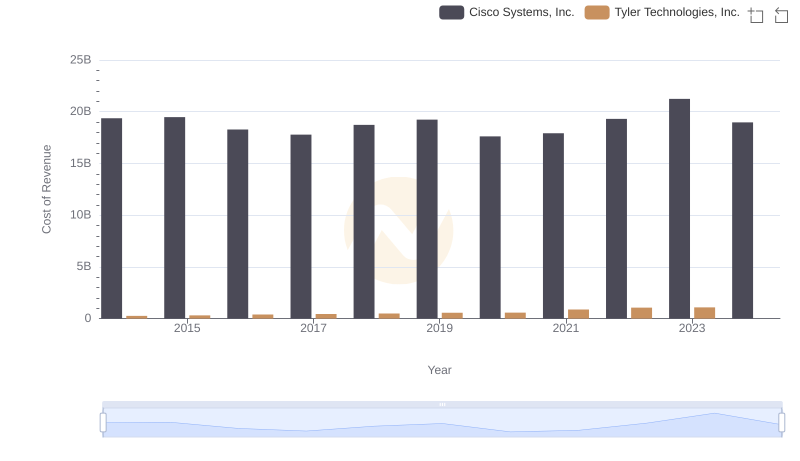
Cost of Revenue Trends: Cisco Systems, Inc. vs Tyler Technologies, Inc.
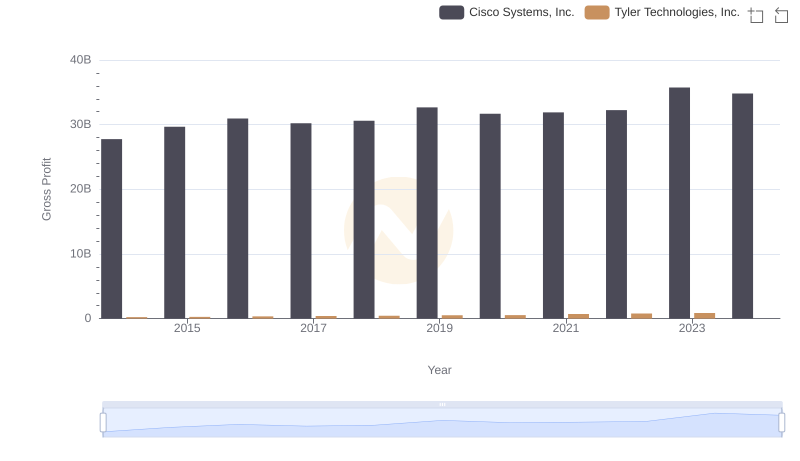
Gross Profit Analysis: Comparing Cisco Systems, Inc. and Tyler Technologies, Inc.
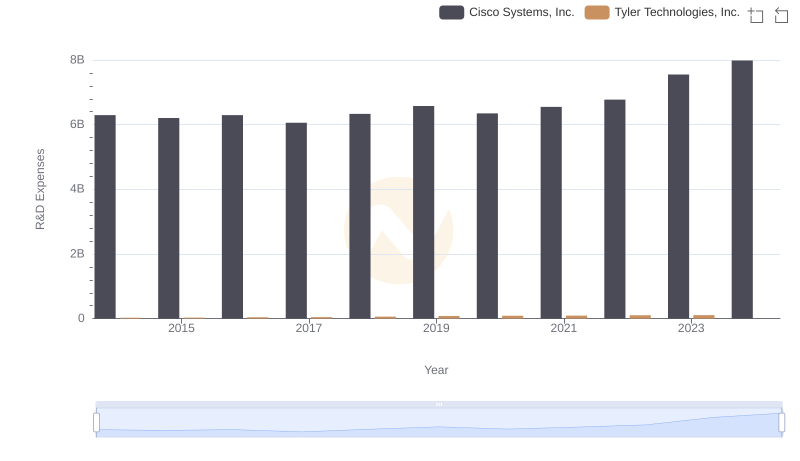
Analyzing R&D Budgets: Cisco Systems, Inc. vs Tyler Technologies, Inc.
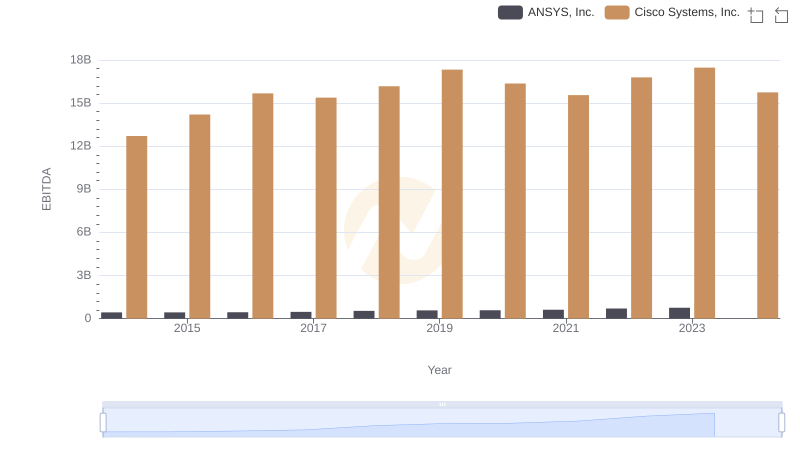
A Side-by-Side Analysis of EBITDA: Cisco Systems, Inc. and ANSYS, Inc.
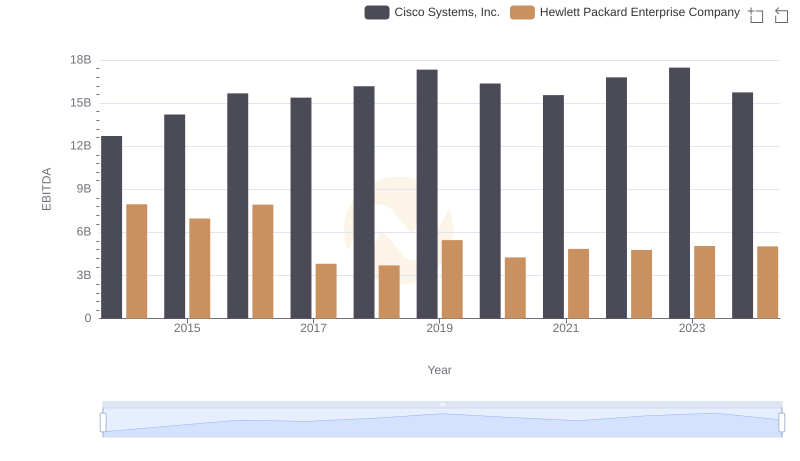
Comparative EBITDA Analysis: Cisco Systems, Inc. vs Hewlett Packard Enterprise Company
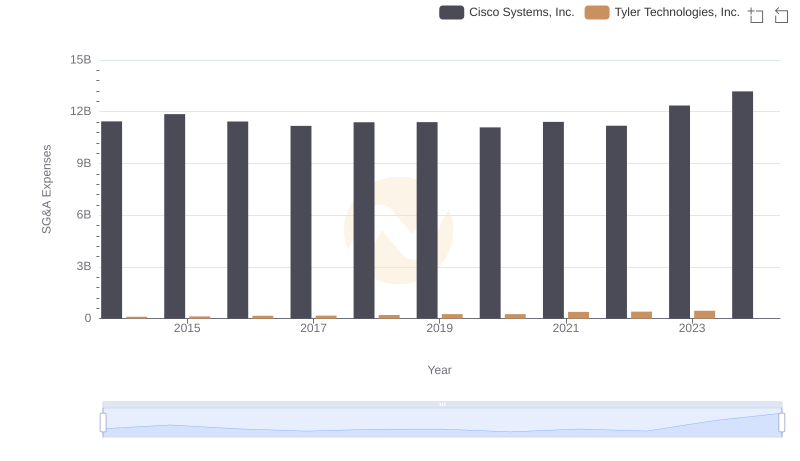
Breaking Down SG&A Expenses: Cisco Systems, Inc. vs Tyler Technologies, Inc.
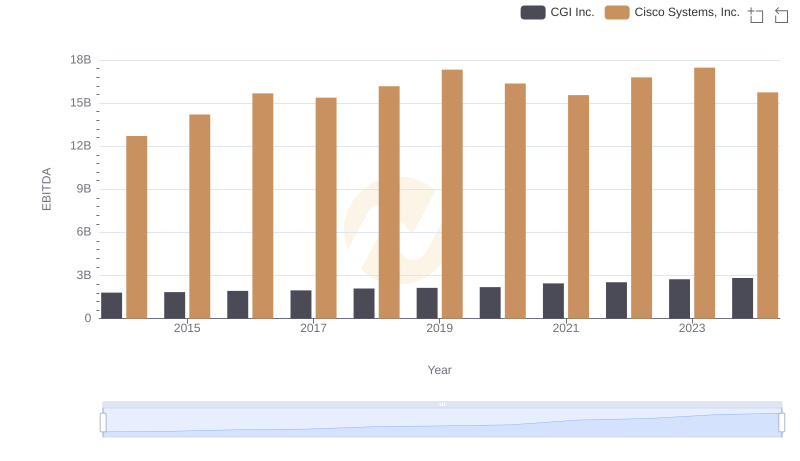
EBITDA Analysis: Evaluating Cisco Systems, Inc. Against CGI Inc.
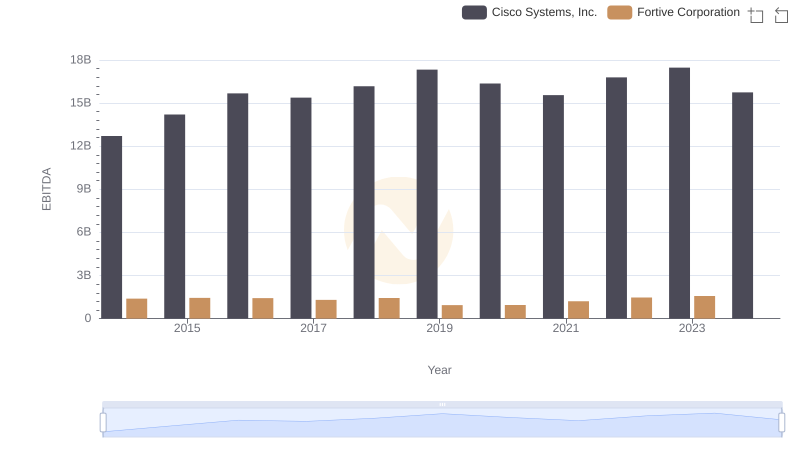
Comprehensive EBITDA Comparison: Cisco Systems, Inc. vs Fortive Corporation
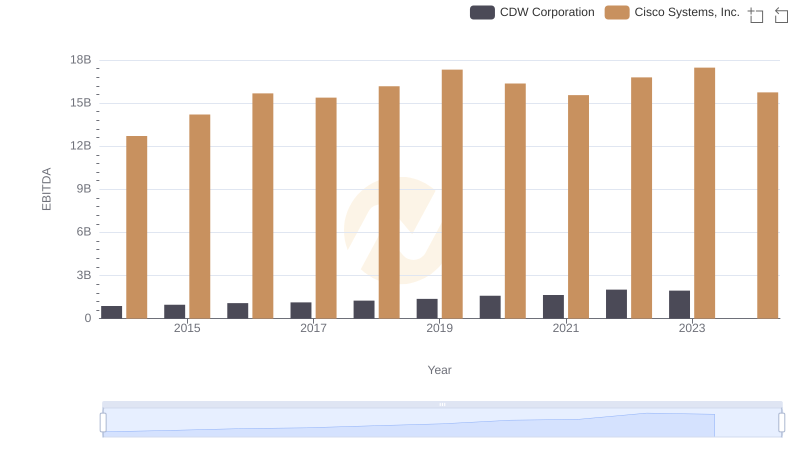
A Side-by-Side Analysis of EBITDA: Cisco Systems, Inc. and CDW Corporation
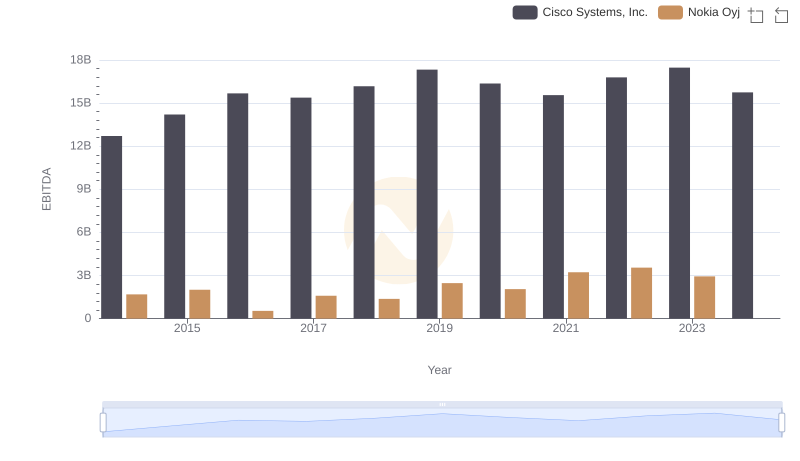
Professional EBITDA Benchmarking: Cisco Systems, Inc. vs Nokia Oyj
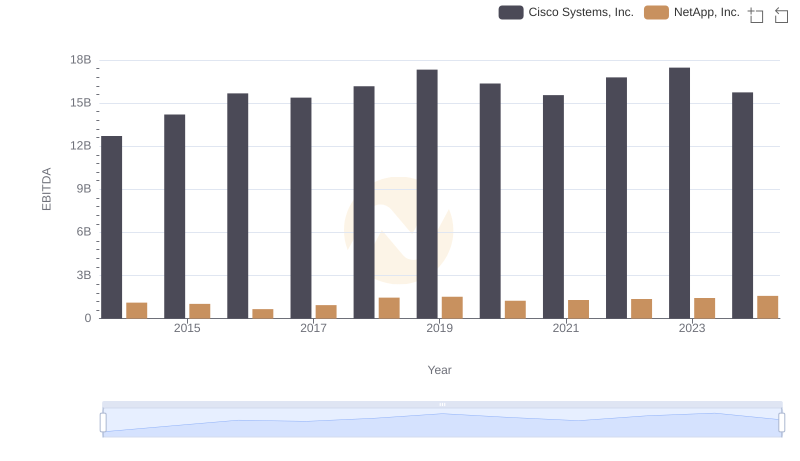
A Side-by-Side Analysis of EBITDA: Cisco Systems, Inc. and NetApp, Inc.