| __timestamp | ANSYS, Inc. | Cisco Systems, Inc. |
|---|---|---|
| Wednesday, January 1, 2014 | 430474000 | 12709000000 |
| Thursday, January 1, 2015 | 431349000 | 14209000000 |
| Friday, January 1, 2016 | 445829000 | 15678000000 |
| Sunday, January 1, 2017 | 466306000 | 15383000000 |
| Monday, January 1, 2018 | 539355000 | 16172000000 |
| Tuesday, January 1, 2019 | 575556000 | 17334000000 |
| Wednesday, January 1, 2020 | 581631000 | 16363000000 |
| Friday, January 1, 2021 | 620138000 | 15558000000 |
| Saturday, January 1, 2022 | 707221000 | 16794000000 |
| Sunday, January 1, 2023 | 758639000 | 17471000000 |
| Monday, January 1, 2024 | 717888000 | 15747000000 |
Infusing magic into the data realm
In the ever-evolving tech industry, understanding financial health is crucial. This analysis of EBITDA from 2014 to 2023 offers a fascinating glimpse into the financial trajectories of Cisco Systems, Inc. and ANSYS, Inc. Over this period, Cisco consistently outperformed ANSYS, with EBITDA figures averaging around $15.8 billion, nearly 28 times higher than ANSYS's average of $556 million. Notably, Cisco's EBITDA peaked in 2023, reaching approximately $17.5 billion, while ANSYS saw its highest EBITDA in the same year at $759 million. This growth trajectory highlights Cisco's robust market position and operational efficiency. However, ANSYS's steady growth, with a 76% increase from 2014 to 2023, underscores its resilience and potential in the competitive tech landscape. Missing data for 2024 suggests a need for cautious optimism as both companies navigate future challenges.
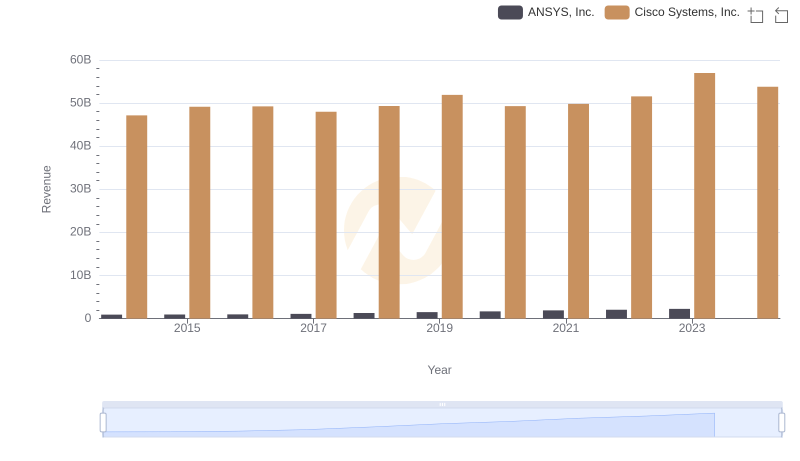
Breaking Down Revenue Trends: Cisco Systems, Inc. vs ANSYS, Inc.
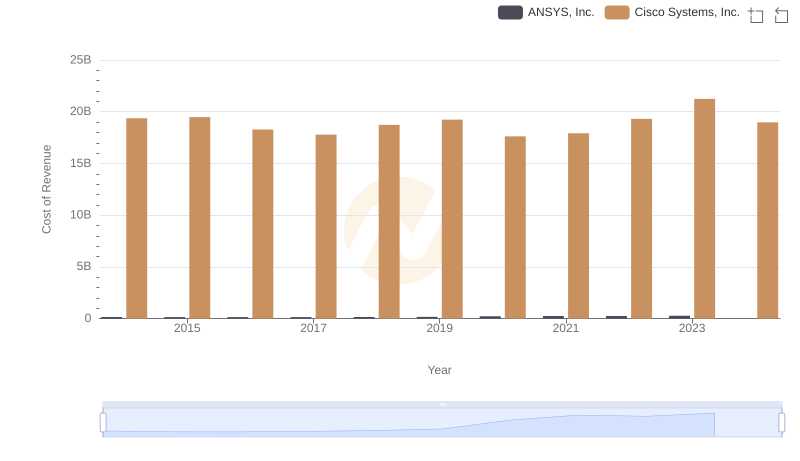
Cost of Revenue Trends: Cisco Systems, Inc. vs ANSYS, Inc.
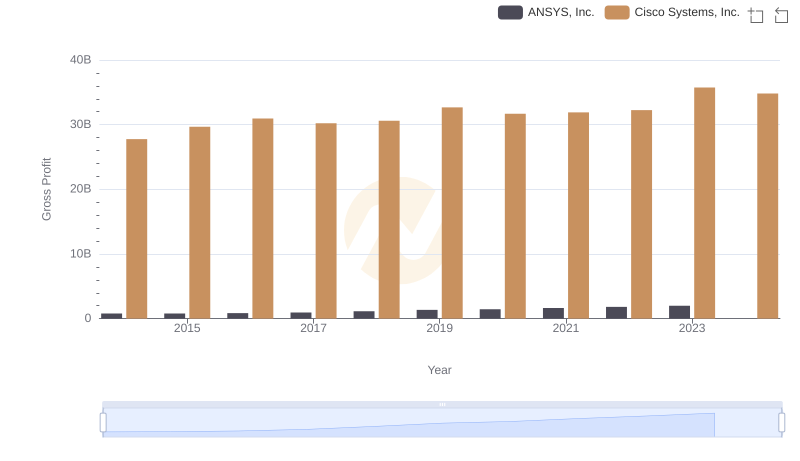
Key Insights on Gross Profit: Cisco Systems, Inc. vs ANSYS, Inc.
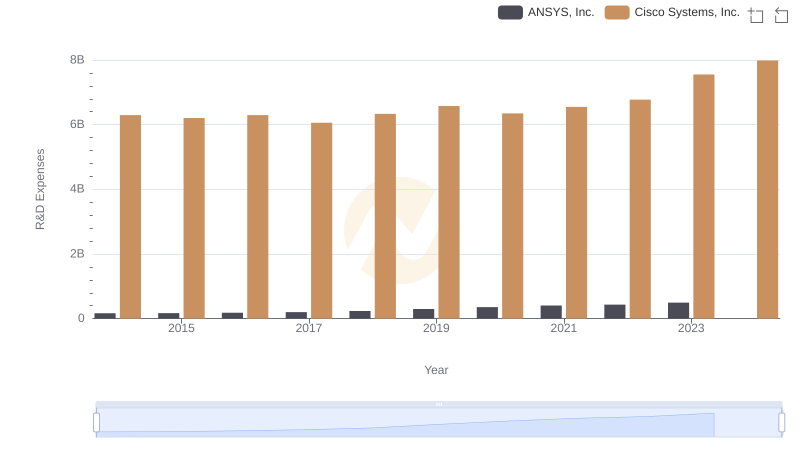
Comparing Innovation Spending: Cisco Systems, Inc. and ANSYS, Inc.
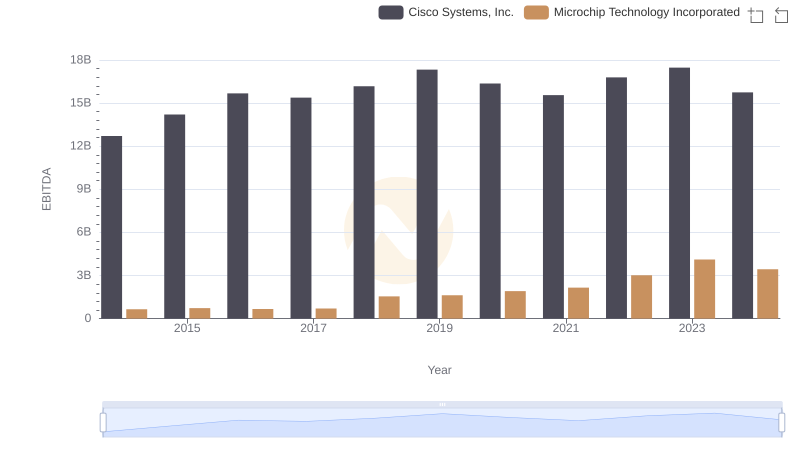
A Side-by-Side Analysis of EBITDA: Cisco Systems, Inc. and Microchip Technology Incorporated
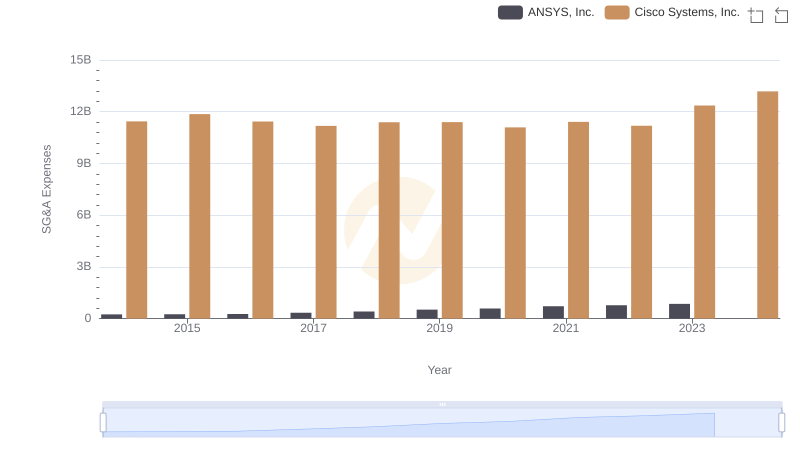
Cisco Systems, Inc. vs ANSYS, Inc.: SG&A Expense Trends

EBITDA Metrics Evaluated: Cisco Systems, Inc. vs Monolithic Power Systems, Inc.
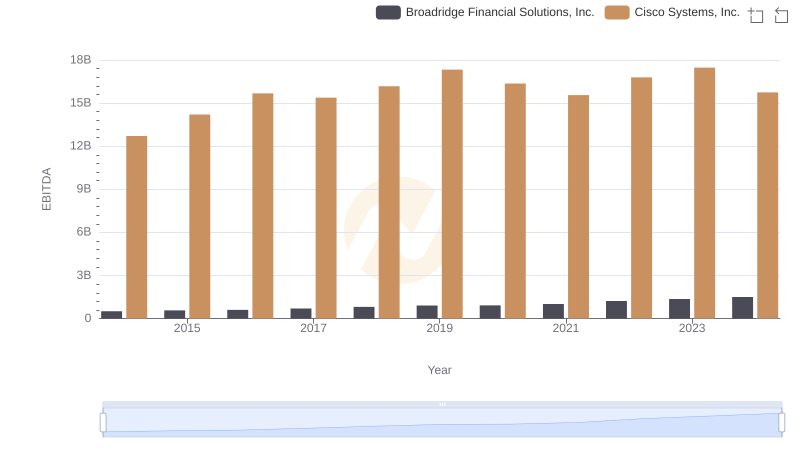
EBITDA Metrics Evaluated: Cisco Systems, Inc. vs Broadridge Financial Solutions, Inc.
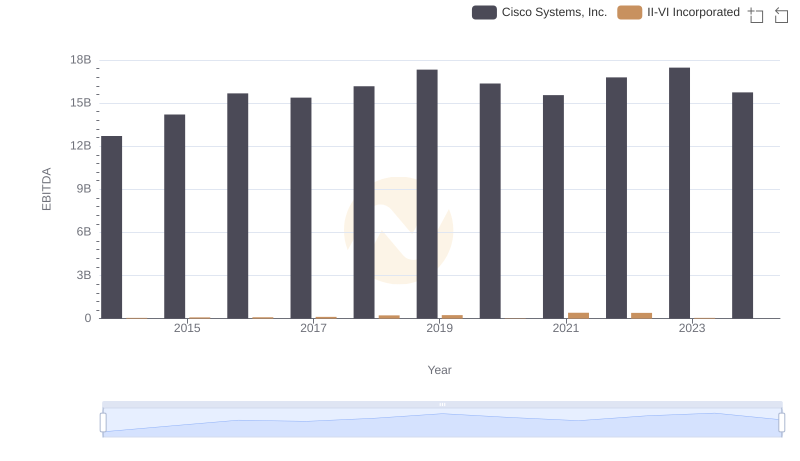
EBITDA Performance Review: Cisco Systems, Inc. vs II-VI Incorporated
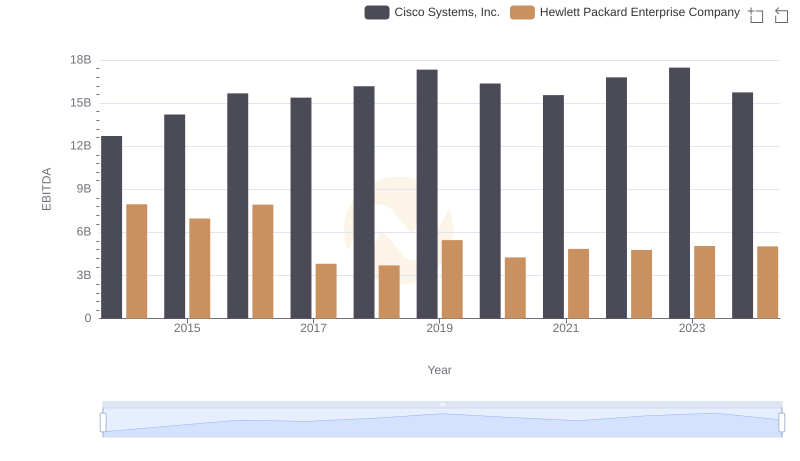
Comparative EBITDA Analysis: Cisco Systems, Inc. vs Hewlett Packard Enterprise Company
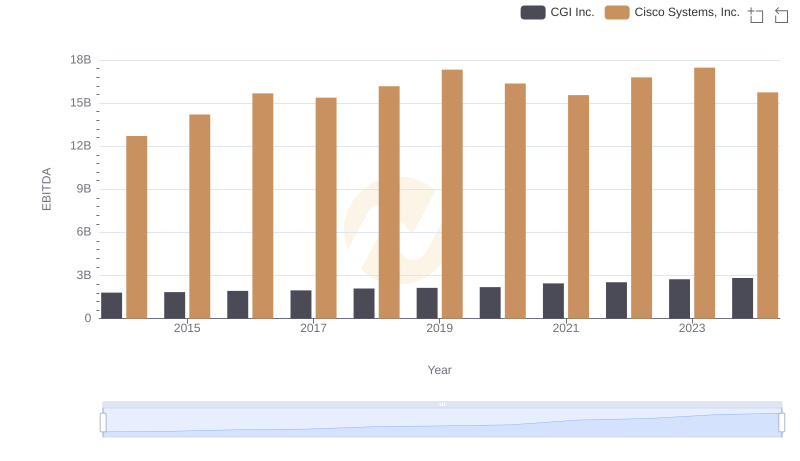
EBITDA Analysis: Evaluating Cisco Systems, Inc. Against CGI Inc.
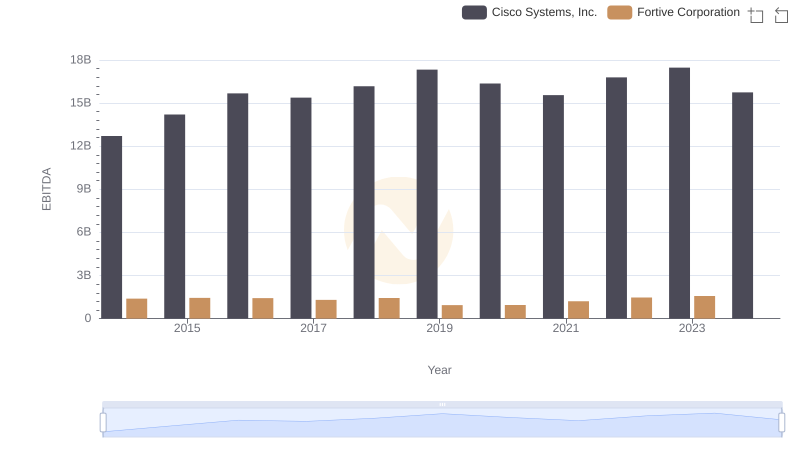
Comprehensive EBITDA Comparison: Cisco Systems, Inc. vs Fortive Corporation