| __timestamp | IDEX Corporation | Lennox International Inc. |
|---|---|---|
| Wednesday, January 1, 2014 | 504419000 | 573700000 |
| Thursday, January 1, 2015 | 479408000 | 580500000 |
| Friday, January 1, 2016 | 498994000 | 621000000 |
| Sunday, January 1, 2017 | 524940000 | 637700000 |
| Monday, January 1, 2018 | 536724000 | 608200000 |
| Tuesday, January 1, 2019 | 524987000 | 585900000 |
| Wednesday, January 1, 2020 | 494935000 | 555900000 |
| Friday, January 1, 2021 | 578200000 | 598900000 |
| Saturday, January 1, 2022 | 652700000 | 627200000 |
| Sunday, January 1, 2023 | 703500000 | 705500000 |
| Monday, January 1, 2024 | 758700000 | 730600000 |
Cracking the code
In the ever-evolving landscape of corporate finance, understanding the trends in Selling, General, and Administrative (SG&A) expenses is crucial for investors and analysts alike. This article delves into the SG&A expense patterns of two industry giants, Lennox International Inc. and IDEX Corporation, from 2014 to 2023.
Lennox International Inc. has shown a steady increase in SG&A expenses, peaking in 2023 with a 23% rise from 2014. In contrast, IDEX Corporation experienced a more volatile trend, with a notable 47% increase in 2023 compared to its 2014 figures. This divergence highlights differing strategic approaches in managing operational costs.
While Lennox's data extends into 2024, IDEX's figures for the same year remain unavailable, leaving room for speculation on future trends.
These insights provide a window into the financial strategies of these corporations, offering valuable information for stakeholders.
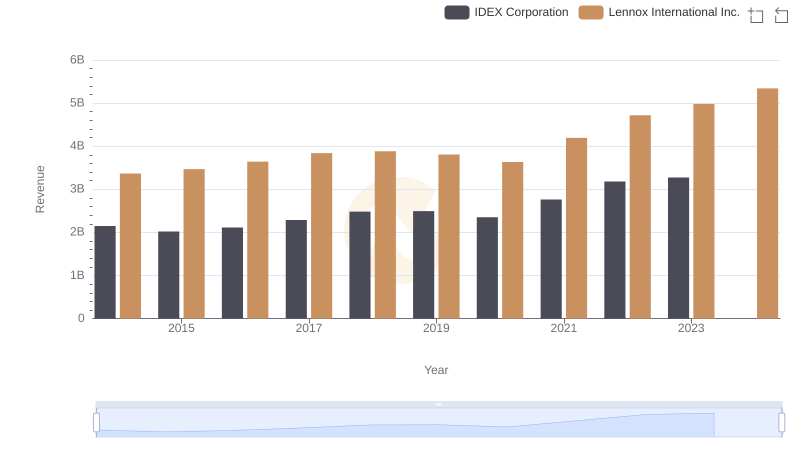
Who Generates More Revenue? Lennox International Inc. or IDEX Corporation
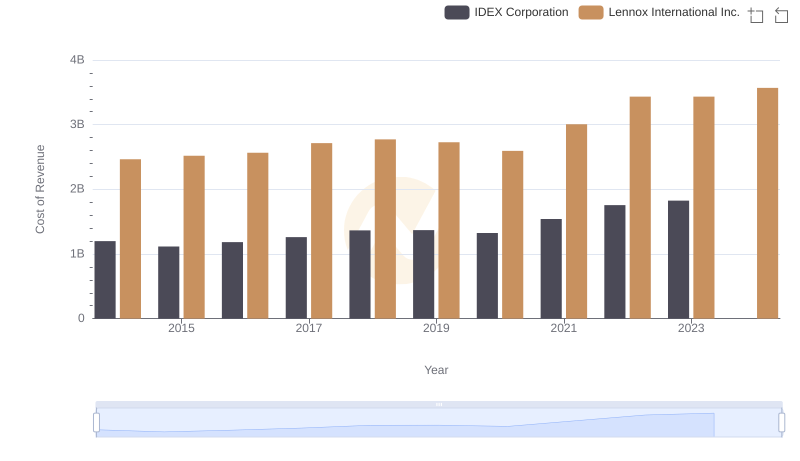
Cost of Revenue Trends: Lennox International Inc. vs IDEX Corporation
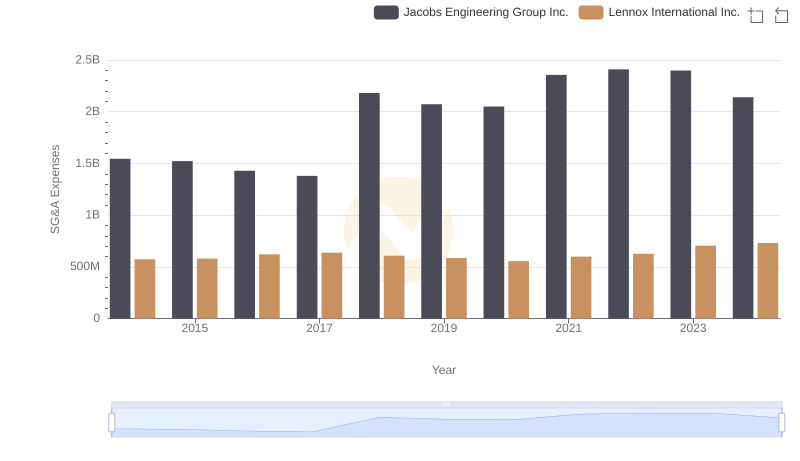
SG&A Efficiency Analysis: Comparing Lennox International Inc. and Jacobs Engineering Group Inc.
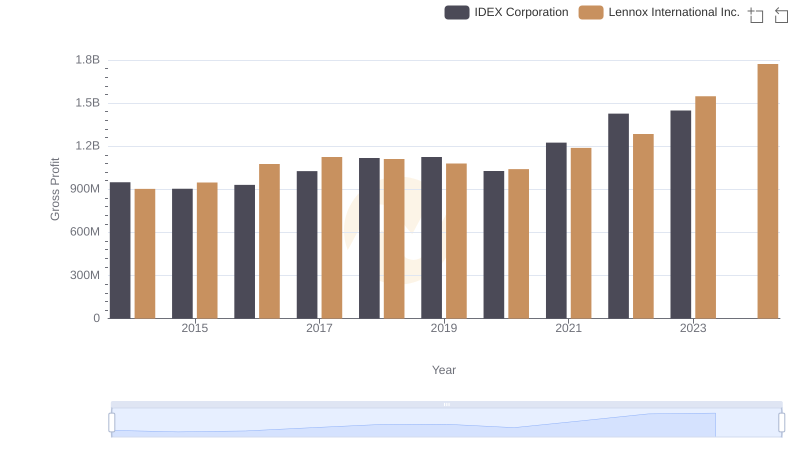
Gross Profit Comparison: Lennox International Inc. and IDEX Corporation Trends
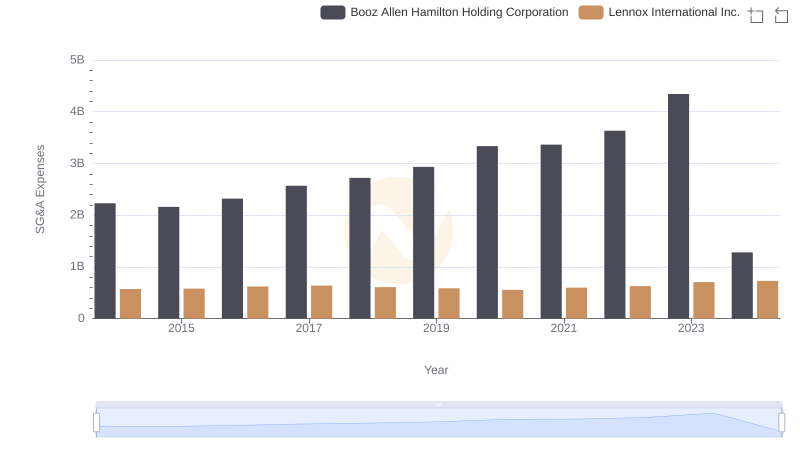
Selling, General, and Administrative Costs: Lennox International Inc. vs Booz Allen Hamilton Holding Corporation
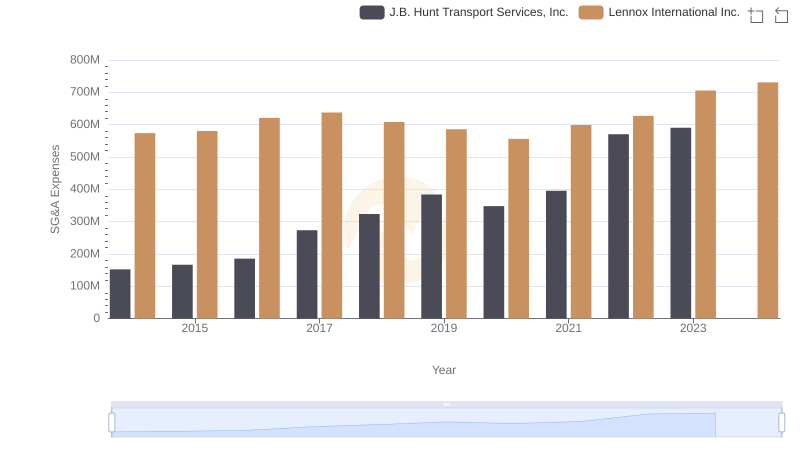
SG&A Efficiency Analysis: Comparing Lennox International Inc. and J.B. Hunt Transport Services, Inc.
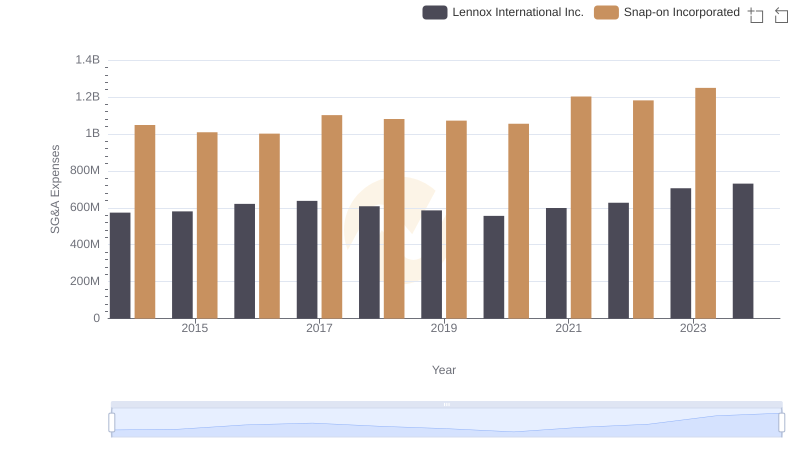
Breaking Down SG&A Expenses: Lennox International Inc. vs Snap-on Incorporated
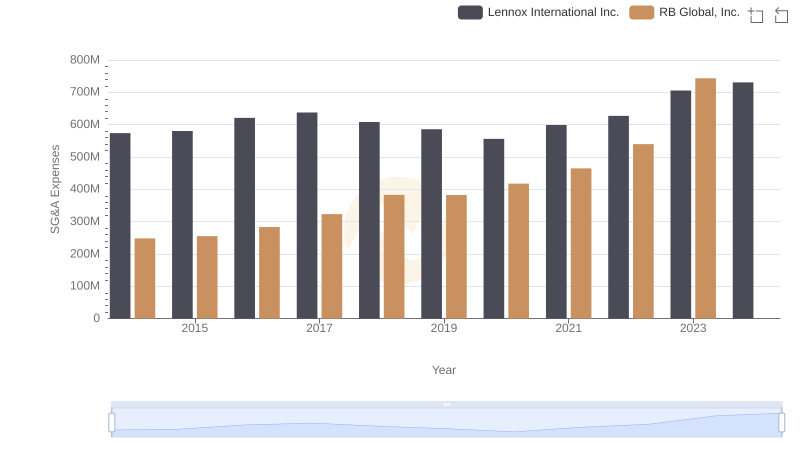
Operational Costs Compared: SG&A Analysis of Lennox International Inc. and RB Global, Inc.
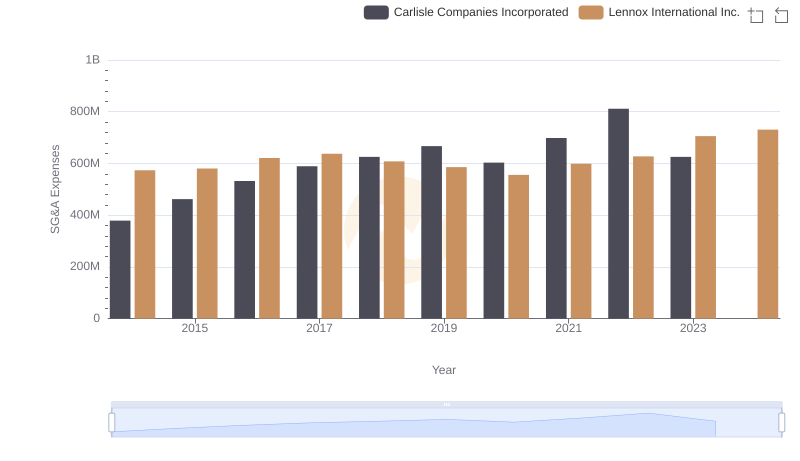
Selling, General, and Administrative Costs: Lennox International Inc. vs Carlisle Companies Incorporated
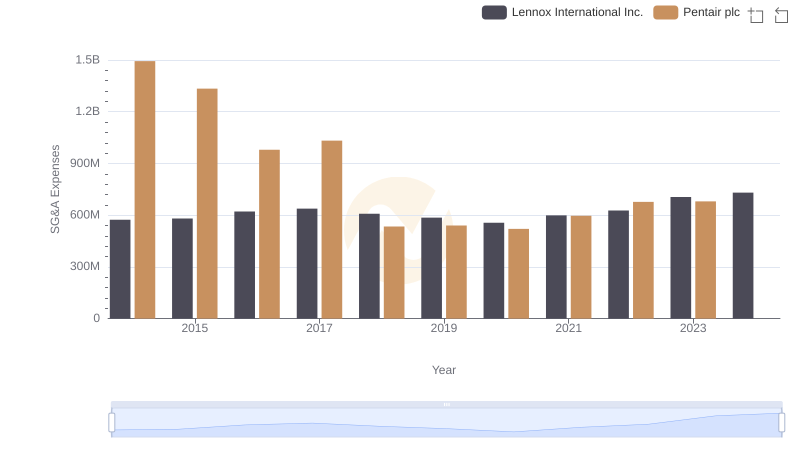
Lennox International Inc. and Pentair plc: SG&A Spending Patterns Compared
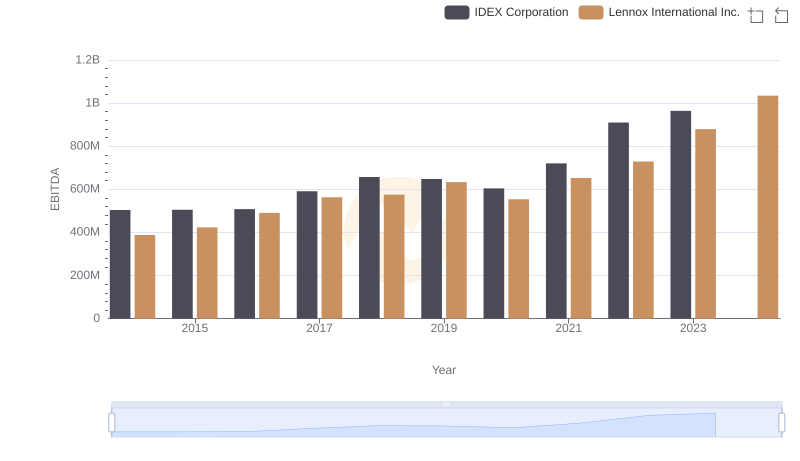
A Professional Review of EBITDA: Lennox International Inc. Compared to IDEX Corporation
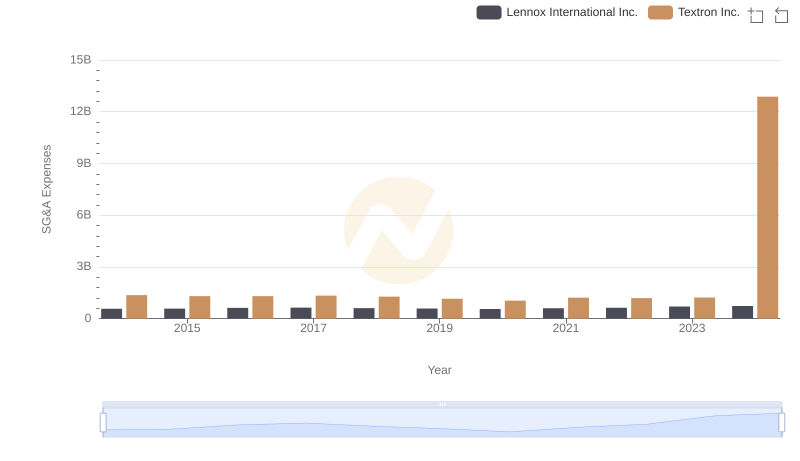
Lennox International Inc. or Textron Inc.: Who Manages SG&A Costs Better?