| __timestamp | IDEX Corporation | Lennox International Inc. |
|---|---|---|
| Wednesday, January 1, 2014 | 2147767000 | 3367400000 |
| Thursday, January 1, 2015 | 2020668000 | 3467400000 |
| Friday, January 1, 2016 | 2113043000 | 3641600000 |
| Sunday, January 1, 2017 | 2287312000 | 3839600000 |
| Monday, January 1, 2018 | 2483666000 | 3883900000 |
| Tuesday, January 1, 2019 | 2494573000 | 3807200000 |
| Wednesday, January 1, 2020 | 2351646000 | 3634100000 |
| Friday, January 1, 2021 | 2764800000 | 4194100000 |
| Saturday, January 1, 2022 | 3181900000 | 4718400000 |
| Sunday, January 1, 2023 | 3273900000 | 4981900000 |
| Monday, January 1, 2024 | 3268800000 | 5341300000 |
Unleashing insights
In the competitive landscape of industrial manufacturing, revenue generation is a key indicator of success. Over the past decade, Lennox International Inc. has consistently outperformed IDEX Corporation in terms of revenue. From 2014 to 2023, Lennox's revenue grew by approximately 48%, peaking at around $5.34 billion in 2023. In contrast, IDEX Corporation saw a 52% increase, reaching about $3.27 billion in the same year.
Lennox's dominance is evident, with its revenue consistently surpassing IDEX's by a significant margin each year. Notably, in 2023, Lennox's revenue was about 52% higher than IDEX's. This trend highlights Lennox's robust market position and strategic growth initiatives. However, IDEX's steady growth trajectory suggests potential for future competition. As we look to 2024, Lennox's data remains strong, while IDEX's figures are yet to be revealed, leaving room for speculation and anticipation.
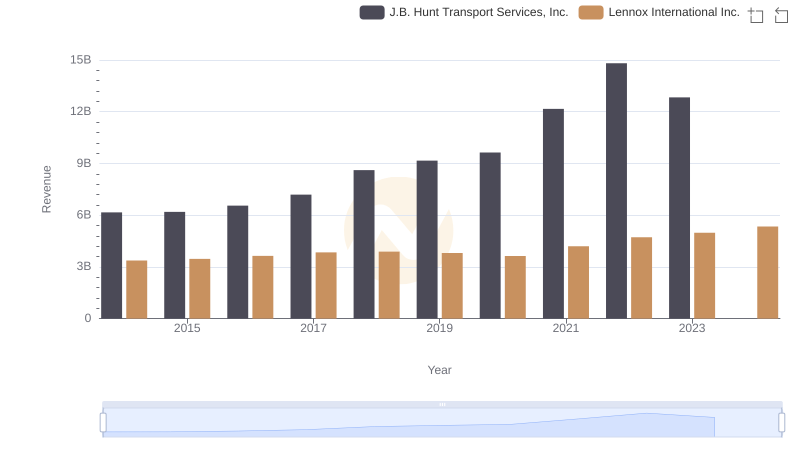
Lennox International Inc. or J.B. Hunt Transport Services, Inc.: Who Leads in Yearly Revenue?
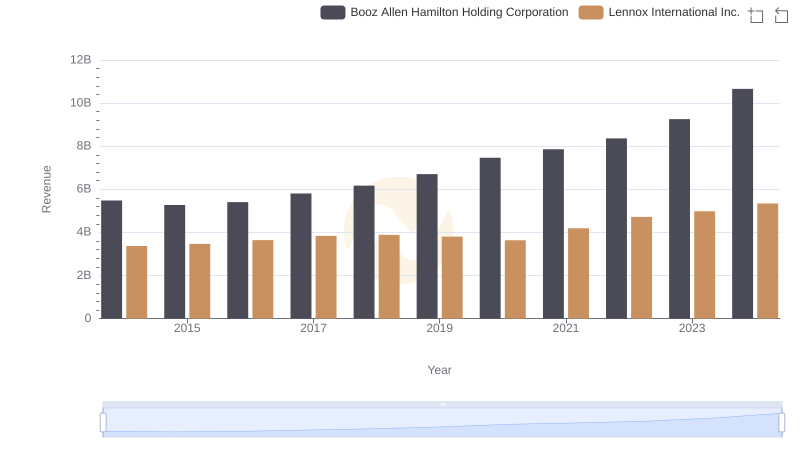
Comparing Revenue Performance: Lennox International Inc. or Booz Allen Hamilton Holding Corporation?
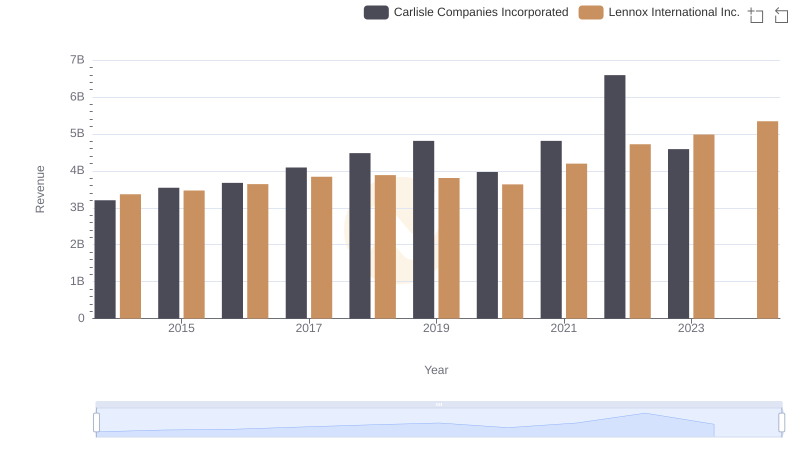
Lennox International Inc. or Carlisle Companies Incorporated: Who Leads in Yearly Revenue?
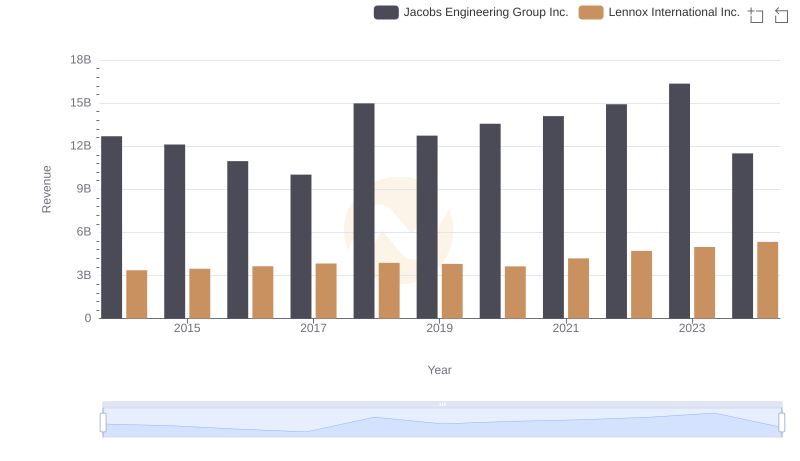
Revenue Showdown: Lennox International Inc. vs Jacobs Engineering Group Inc.
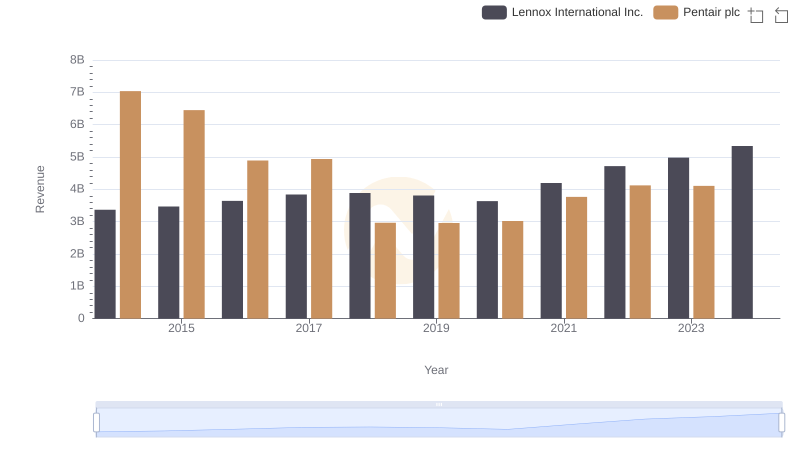
Lennox International Inc. and Pentair plc: A Comprehensive Revenue Analysis
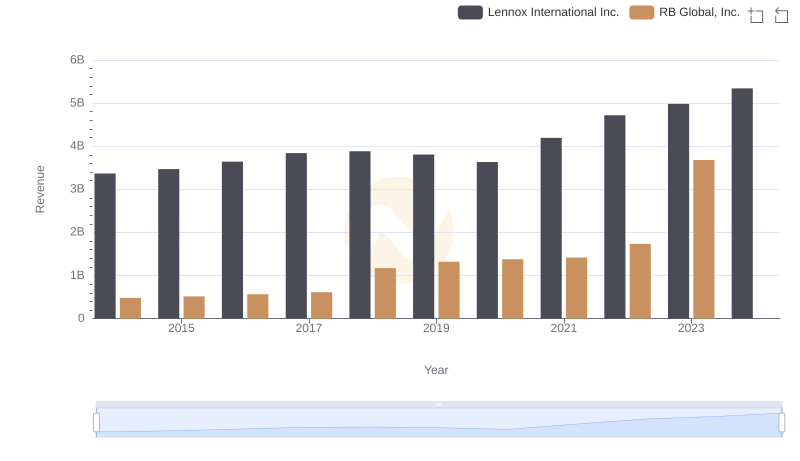
Comparing Revenue Performance: Lennox International Inc. or RB Global, Inc.?
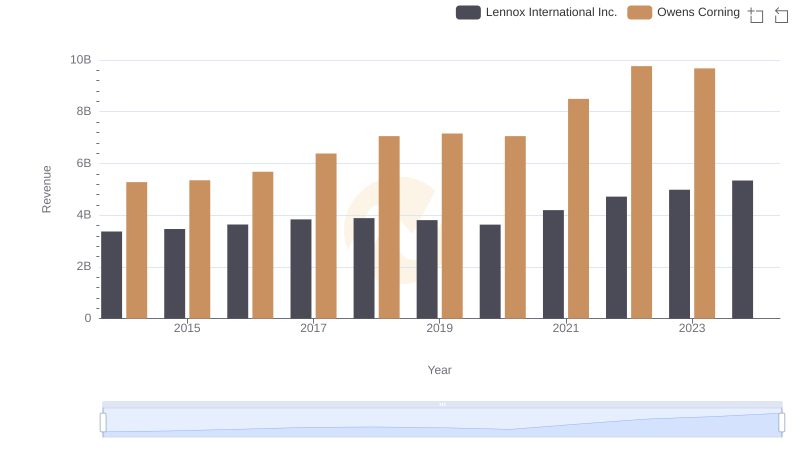
Lennox International Inc. and Owens Corning: A Comprehensive Revenue Analysis
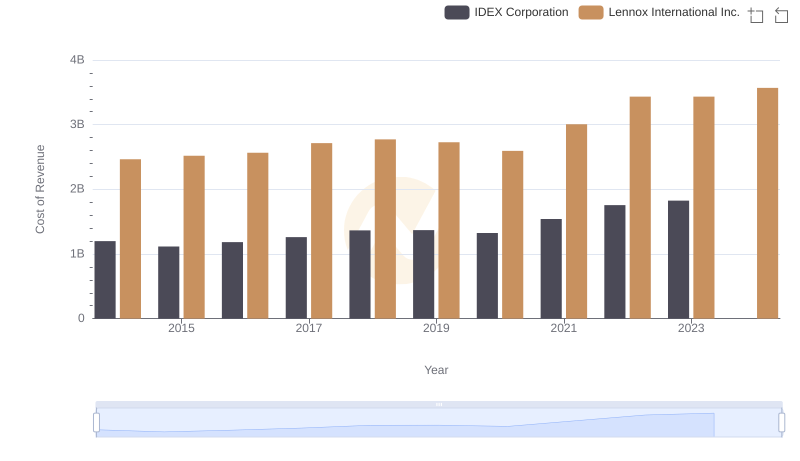
Cost of Revenue Trends: Lennox International Inc. vs IDEX Corporation
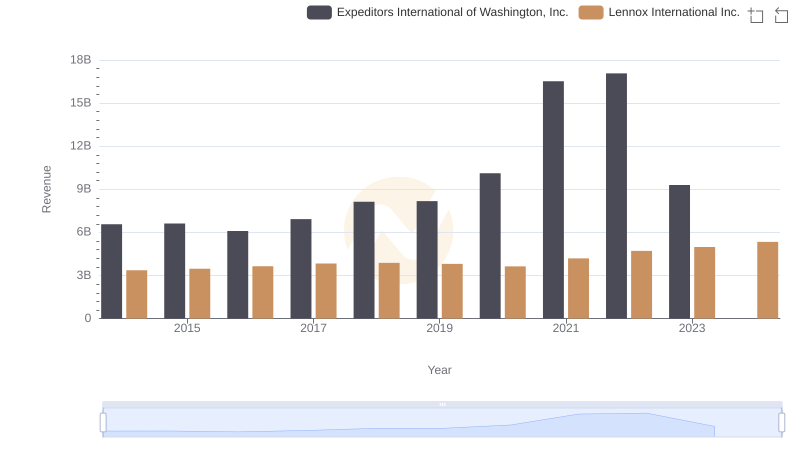
Lennox International Inc. vs Expeditors International of Washington, Inc.: Examining Key Revenue Metrics
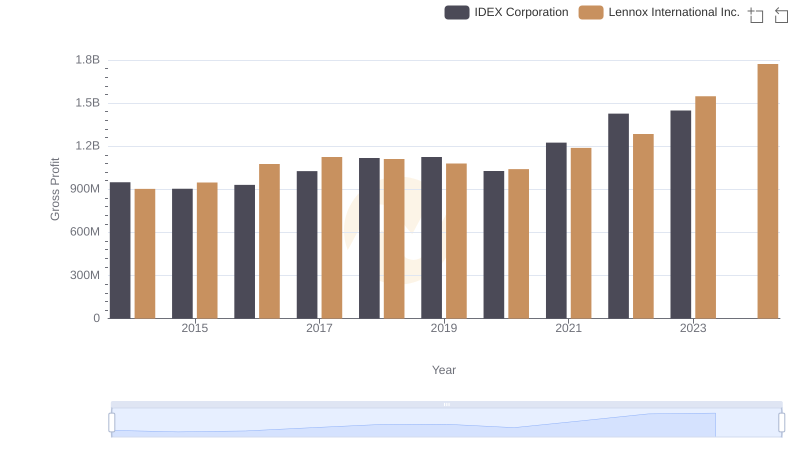
Gross Profit Comparison: Lennox International Inc. and IDEX Corporation Trends
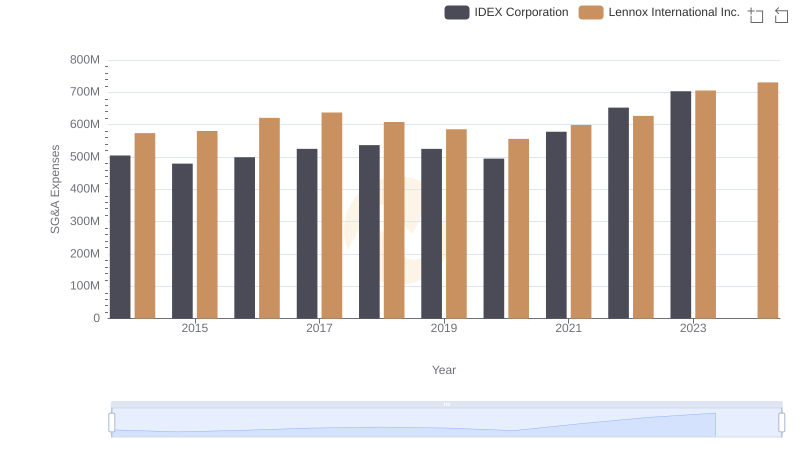
Lennox International Inc. vs IDEX Corporation: SG&A Expense Trends
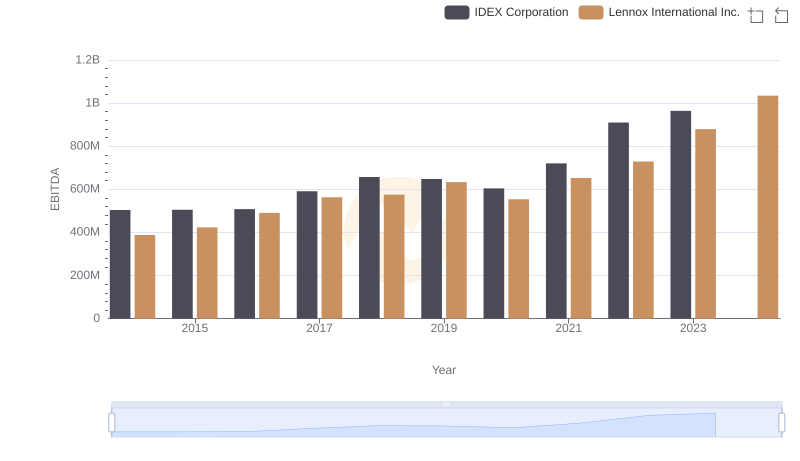
A Professional Review of EBITDA: Lennox International Inc. Compared to IDEX Corporation