| __timestamp | Curtiss-Wright Corporation | EMCOR Group, Inc. |
|---|---|---|
| Wednesday, January 1, 2014 | 2243126000 | 6424965000 |
| Thursday, January 1, 2015 | 2205683000 | 6718726000 |
| Friday, January 1, 2016 | 2108931000 | 7551524000 |
| Sunday, January 1, 2017 | 2271026000 | 7686999000 |
| Monday, January 1, 2018 | 2411835000 | 8130631000 |
| Tuesday, January 1, 2019 | 2487961000 | 9174611000 |
| Wednesday, January 1, 2020 | 2391336000 | 8797061000 |
| Friday, January 1, 2021 | 2505931000 | 9903580000 |
| Saturday, January 1, 2022 | 2557025000 | 11076120000 |
| Sunday, January 1, 2023 | 2845373000 | 12582873000 |
| Monday, January 1, 2024 | 3121189000 |
Data in motion
In the competitive landscape of industrial services and manufacturing, EMCOR Group, Inc. and Curtiss-Wright Corporation have showcased remarkable revenue trajectories over the past decade. From 2014 to 2023, EMCOR Group, Inc. has consistently outperformed Curtiss-Wright Corporation, with its revenue growing by approximately 96%, reaching a peak in 2023. In contrast, Curtiss-Wright Corporation experienced a more modest growth of around 27% during the same period.
This analysis highlights the dynamic shifts in revenue performance, offering valuable insights for investors and industry analysts alike.
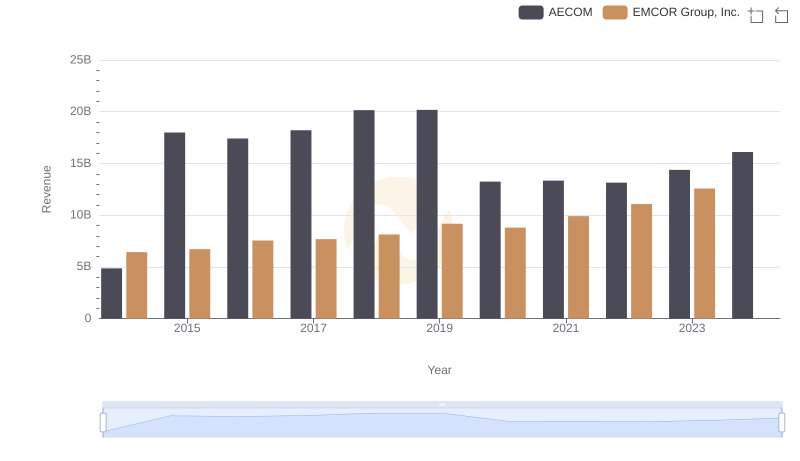
Revenue Insights: EMCOR Group, Inc. and AECOM Performance Compared
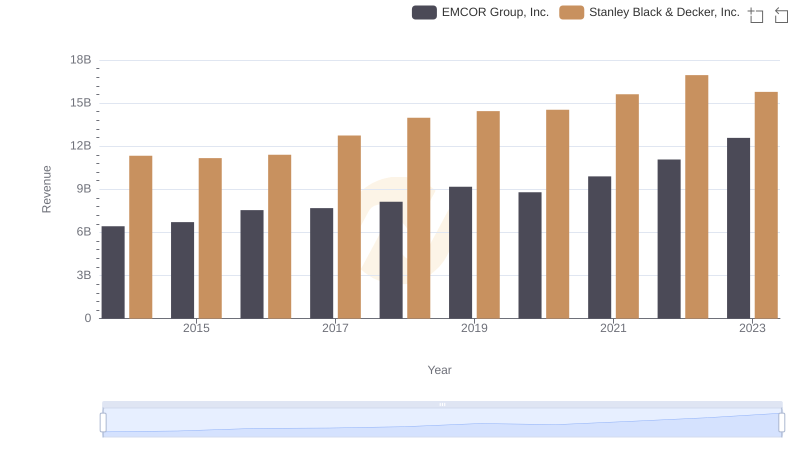
EMCOR Group, Inc. or Stanley Black & Decker, Inc.: Who Leads in Yearly Revenue?
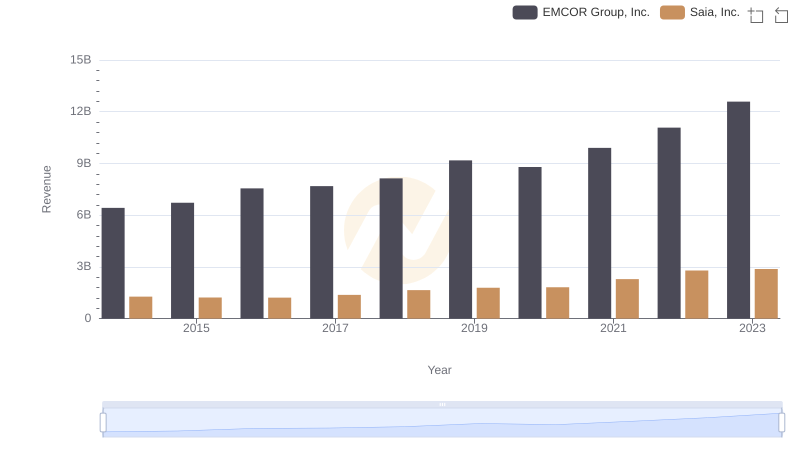
EMCOR Group, Inc. or Saia, Inc.: Who Leads in Yearly Revenue?
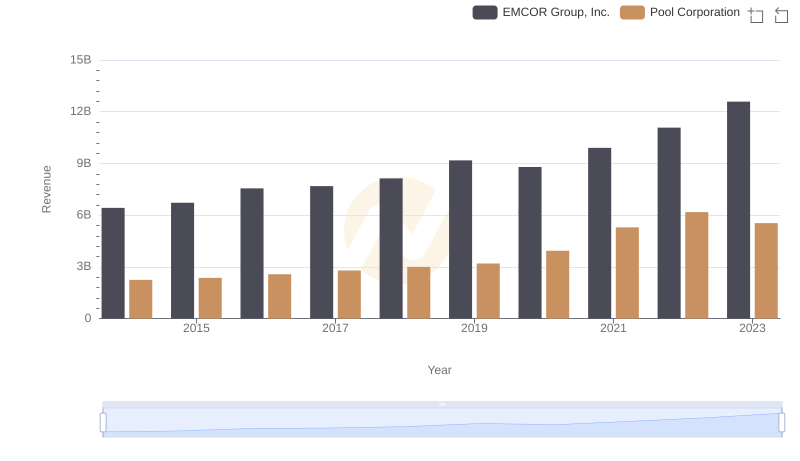
Annual Revenue Comparison: EMCOR Group, Inc. vs Pool Corporation
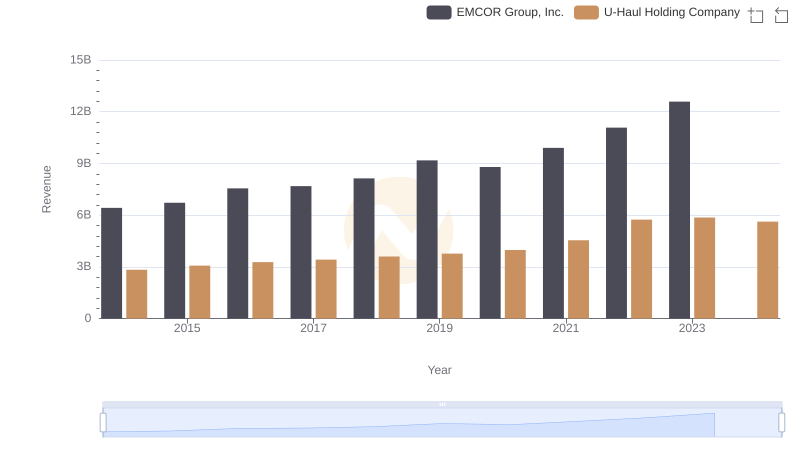
Comparing Revenue Performance: EMCOR Group, Inc. or U-Haul Holding Company?
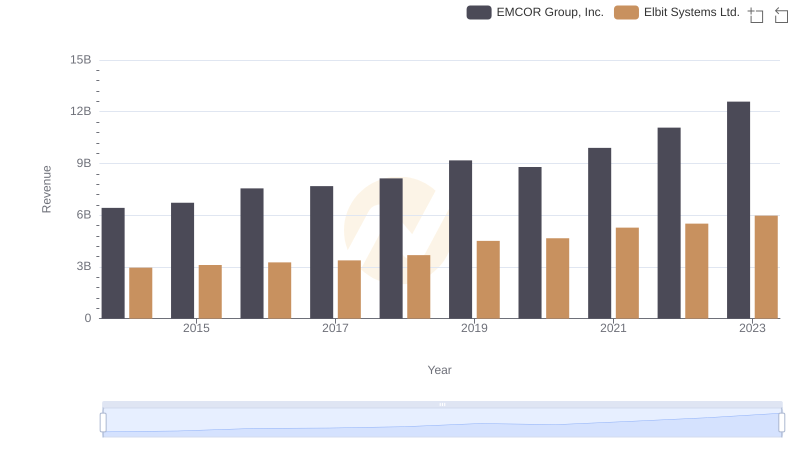
Comparing Revenue Performance: EMCOR Group, Inc. or Elbit Systems Ltd.?
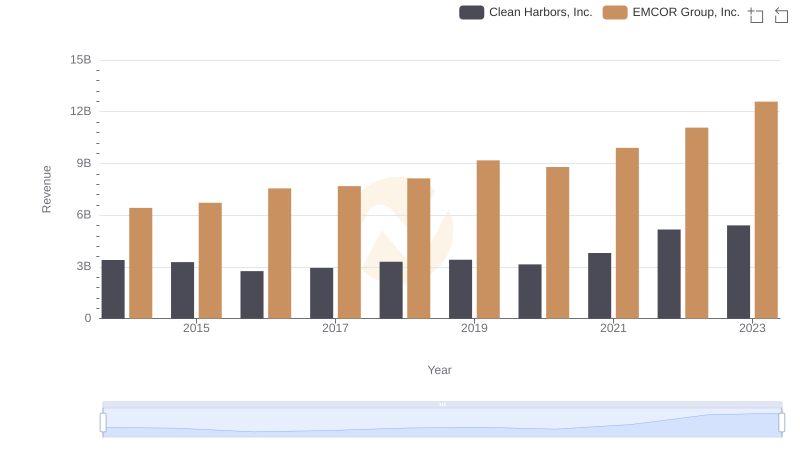
Breaking Down Revenue Trends: EMCOR Group, Inc. vs Clean Harbors, Inc.
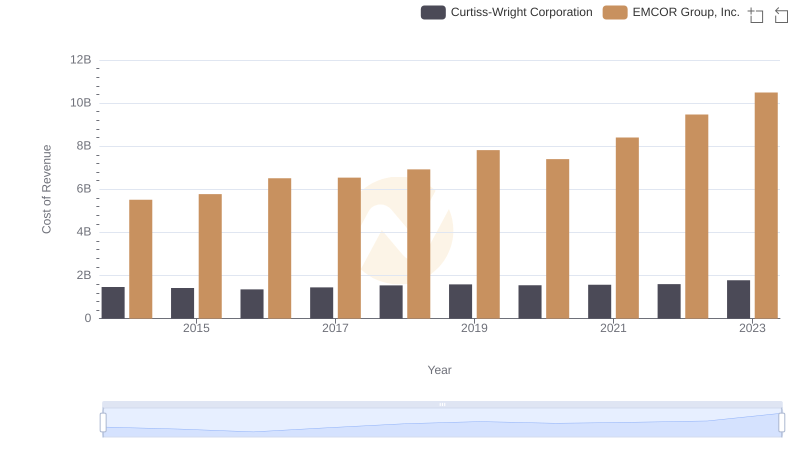
Comparing Cost of Revenue Efficiency: EMCOR Group, Inc. vs Curtiss-Wright Corporation
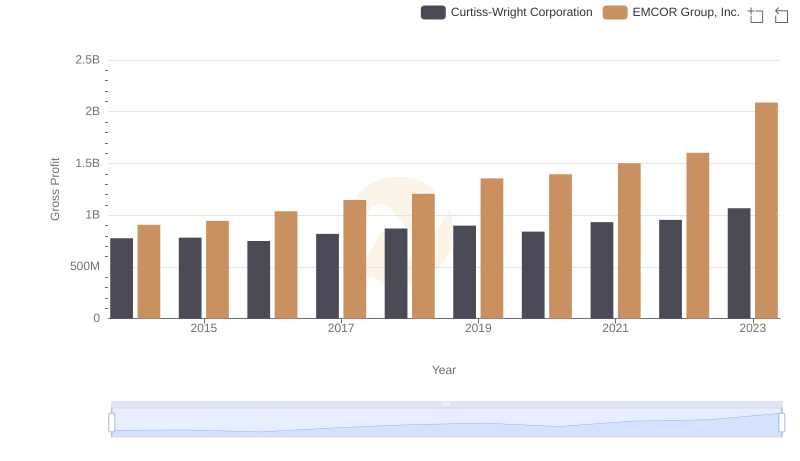
EMCOR Group, Inc. and Curtiss-Wright Corporation: A Detailed Gross Profit Analysis
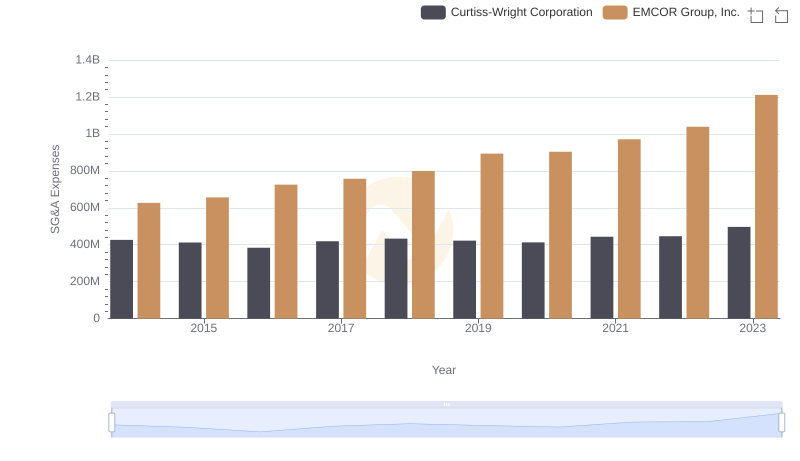
EMCOR Group, Inc. vs Curtiss-Wright Corporation: SG&A Expense Trends
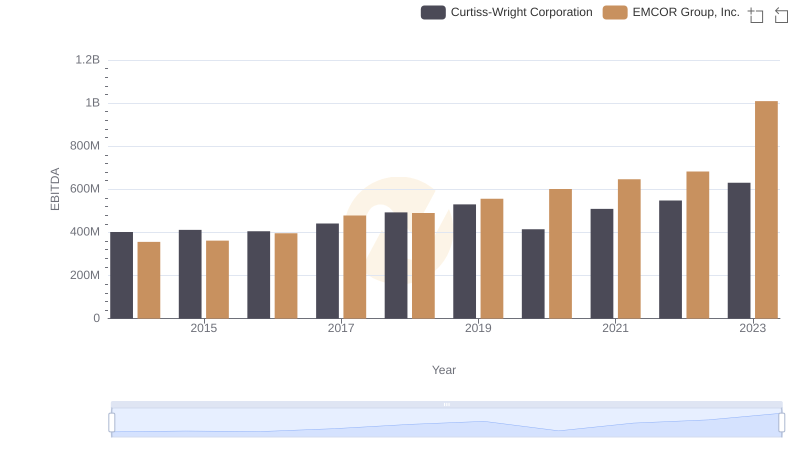
EBITDA Metrics Evaluated: EMCOR Group, Inc. vs Curtiss-Wright Corporation