| __timestamp | Clean Harbors, Inc. | EMCOR Group, Inc. |
|---|---|---|
| Wednesday, January 1, 2014 | 3401636000 | 6424965000 |
| Thursday, January 1, 2015 | 3275137000 | 6718726000 |
| Friday, January 1, 2016 | 2755226000 | 7551524000 |
| Sunday, January 1, 2017 | 2944978000 | 7686999000 |
| Monday, January 1, 2018 | 3300303000 | 8130631000 |
| Tuesday, January 1, 2019 | 3412190000 | 9174611000 |
| Wednesday, January 1, 2020 | 3144097000 | 8797061000 |
| Friday, January 1, 2021 | 3805566000 | 9903580000 |
| Saturday, January 1, 2022 | 5166605000 | 11076120000 |
| Sunday, January 1, 2023 | 5409152000 | 12582873000 |
| Monday, January 1, 2024 | 5889952000 |
Unlocking the unknown
In the competitive landscape of industrial services, EMCOR Group, Inc. and Clean Harbors, Inc. have shown distinct revenue trajectories over the past decade. From 2014 to 2023, EMCOR Group, Inc. has consistently outpaced Clean Harbors, Inc. in revenue growth. Starting at approximately $6.4 billion in 2014, EMCOR's revenue surged by nearly 96% to reach $12.6 billion in 2023. In contrast, Clean Harbors, Inc. began with $3.4 billion in 2014 and experienced a more modest growth of around 59%, reaching $5.4 billion by 2023.
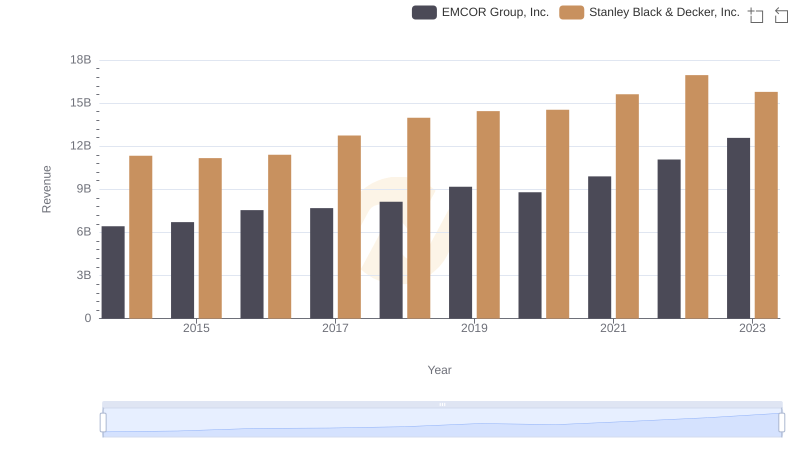
EMCOR Group, Inc. or Stanley Black & Decker, Inc.: Who Leads in Yearly Revenue?
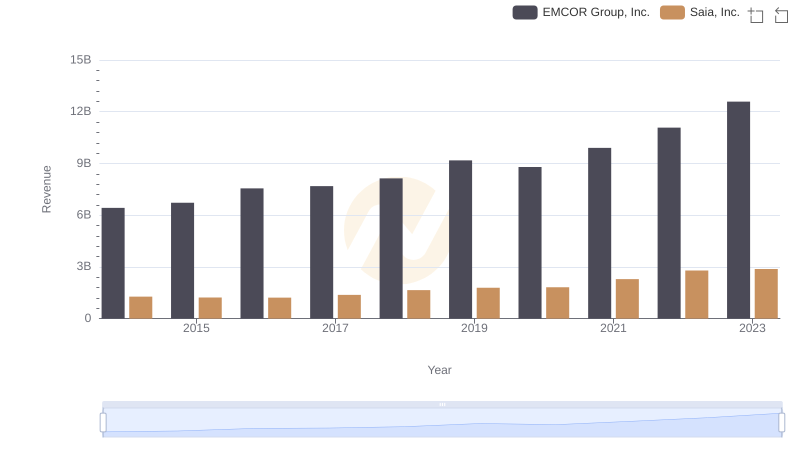
EMCOR Group, Inc. or Saia, Inc.: Who Leads in Yearly Revenue?
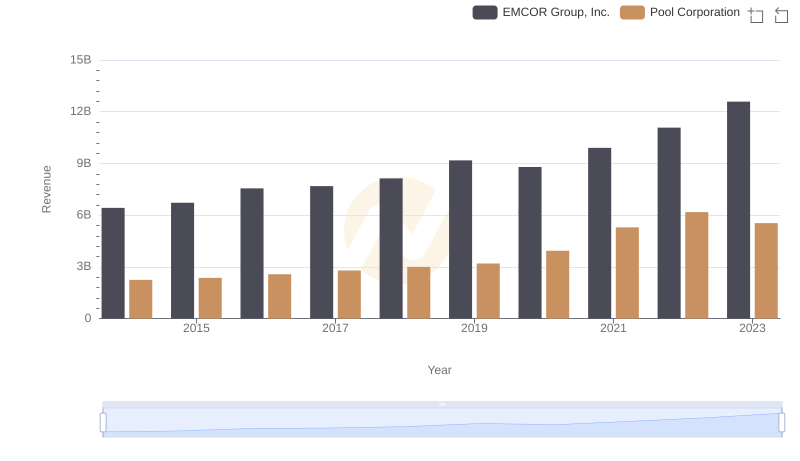
Annual Revenue Comparison: EMCOR Group, Inc. vs Pool Corporation
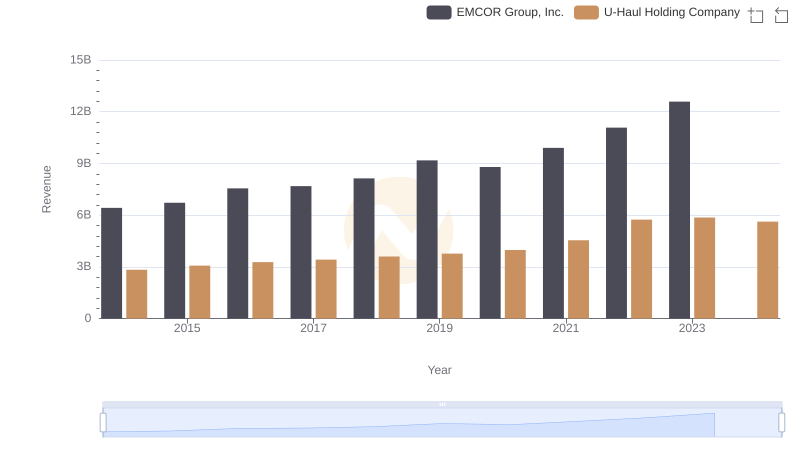
Comparing Revenue Performance: EMCOR Group, Inc. or U-Haul Holding Company?
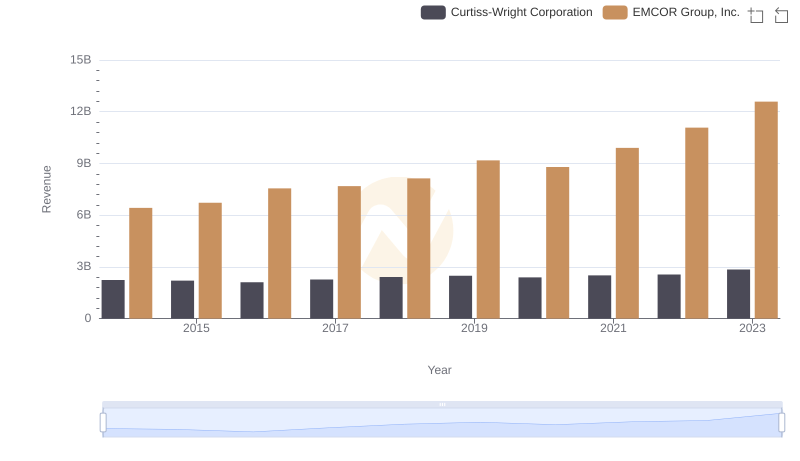
Comparing Revenue Performance: EMCOR Group, Inc. or Curtiss-Wright Corporation?
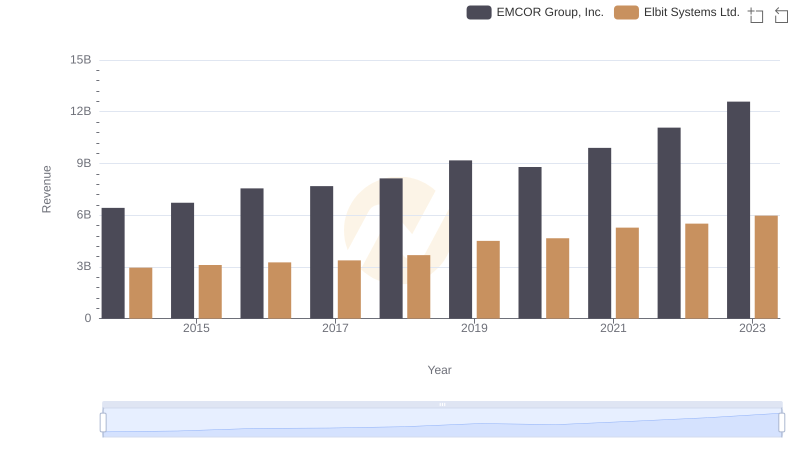
Comparing Revenue Performance: EMCOR Group, Inc. or Elbit Systems Ltd.?
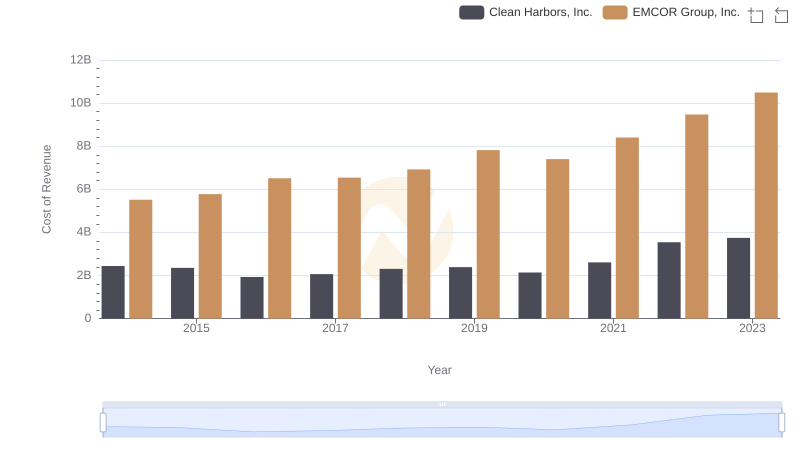
Cost of Revenue Trends: EMCOR Group, Inc. vs Clean Harbors, Inc.
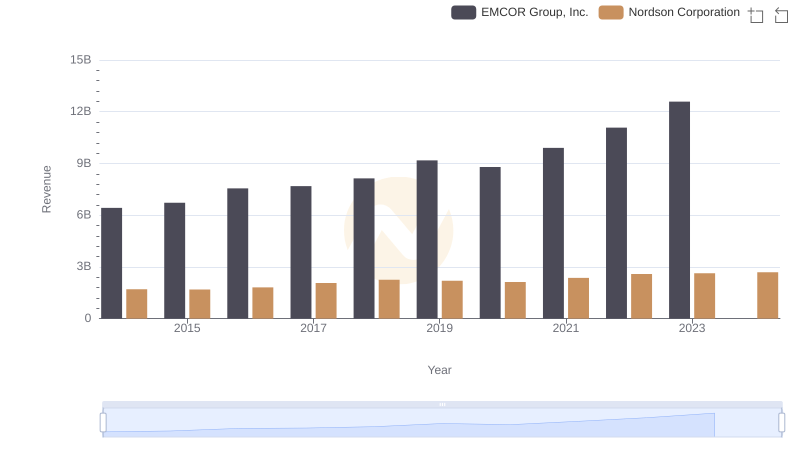
Who Generates More Revenue? EMCOR Group, Inc. or Nordson Corporation
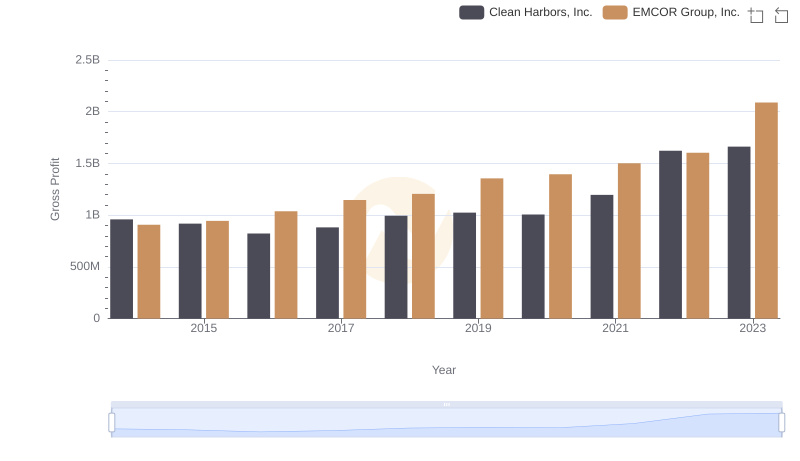
EMCOR Group, Inc. and Clean Harbors, Inc.: A Detailed Gross Profit Analysis
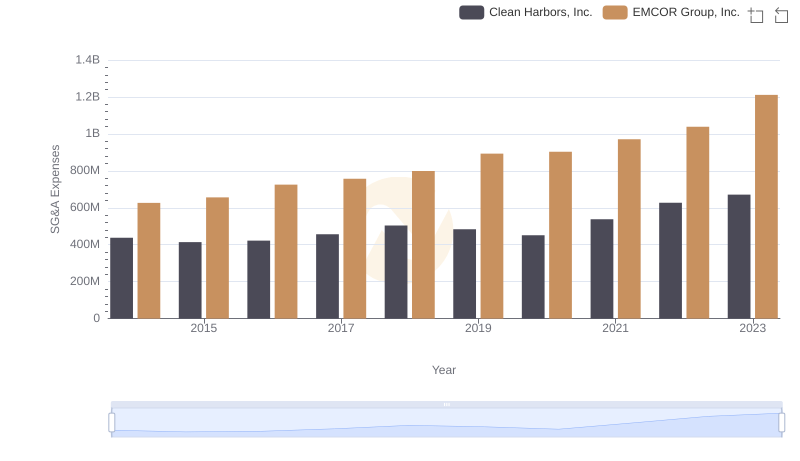
EMCOR Group, Inc. and Clean Harbors, Inc.: SG&A Spending Patterns Compared
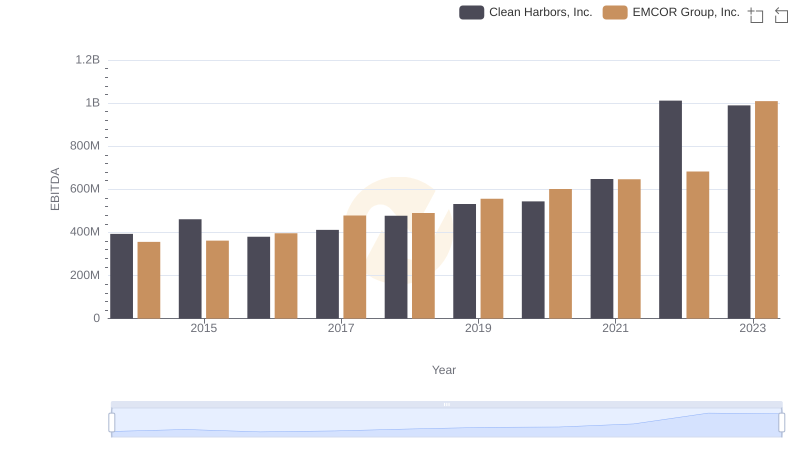
EBITDA Metrics Evaluated: EMCOR Group, Inc. vs Clean Harbors, Inc.