| __timestamp | EMCOR Group, Inc. | Elbit Systems Ltd. |
|---|---|---|
| Wednesday, January 1, 2014 | 6424965000 | 2958248000 |
| Thursday, January 1, 2015 | 6718726000 | 3107581000 |
| Friday, January 1, 2016 | 7551524000 | 3260219000 |
| Sunday, January 1, 2017 | 7686999000 | 3377825000 |
| Monday, January 1, 2018 | 8130631000 | 3683684000 |
| Tuesday, January 1, 2019 | 9174611000 | 4508400000 |
| Wednesday, January 1, 2020 | 8797061000 | 4662572000 |
| Friday, January 1, 2021 | 9903580000 | 5278521000 |
| Saturday, January 1, 2022 | 11076120000 | 5511549000 |
| Sunday, January 1, 2023 | 12582873000 | 5974744000 |
Cracking the code
In the competitive landscape of global industries, revenue performance is a key indicator of success. Over the past decade, EMCOR Group, Inc. has demonstrated a robust growth trajectory, with its revenue increasing by approximately 96% from 2014 to 2023. Starting at around $6.4 billion in 2014, EMCOR's revenue surged to an impressive $12.6 billion by 2023. This growth reflects a compound annual growth rate (CAGR) of about 7.5%, showcasing EMCOR's resilience and strategic prowess.
In contrast, Elbit Systems Ltd. has also shown steady growth, albeit at a more modest pace. From 2014 to 2023, Elbit's revenue grew by roughly 102%, from $3 billion to nearly $6 billion. This represents a CAGR of approximately 8%, indicating consistent performance in the defense and aerospace sectors.
These figures highlight the dynamic nature of these industries and the strategic initiatives driving revenue growth.
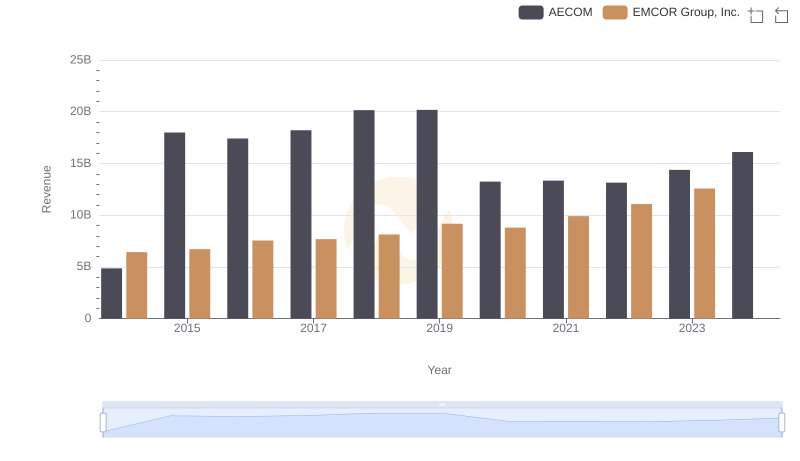
Revenue Insights: EMCOR Group, Inc. and AECOM Performance Compared
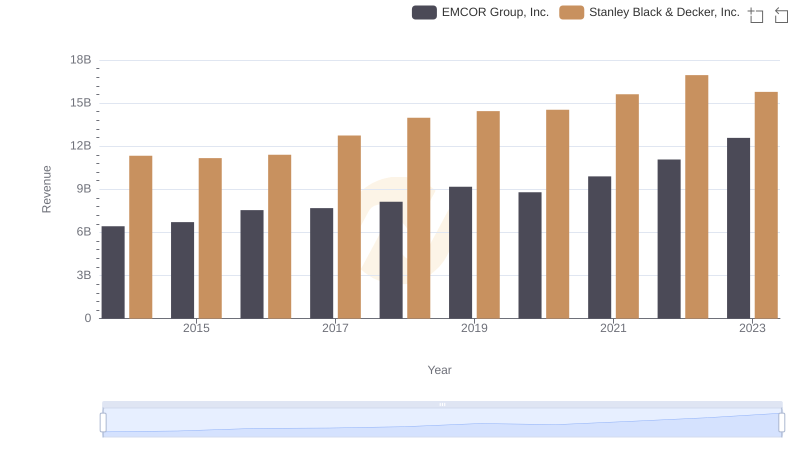
EMCOR Group, Inc. or Stanley Black & Decker, Inc.: Who Leads in Yearly Revenue?
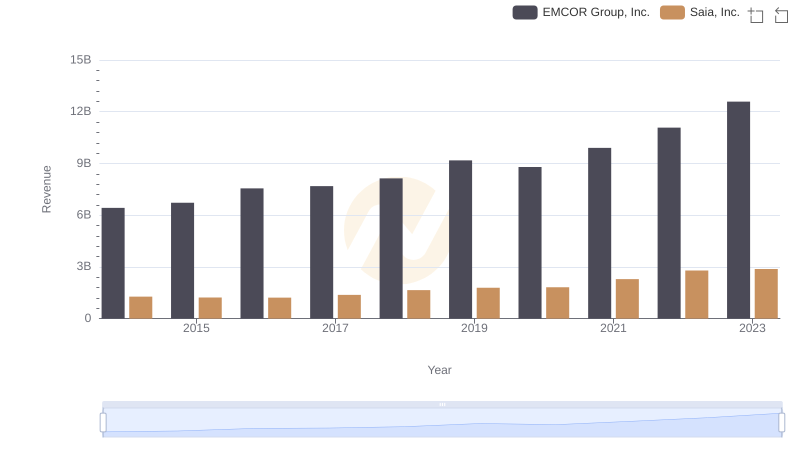
EMCOR Group, Inc. or Saia, Inc.: Who Leads in Yearly Revenue?
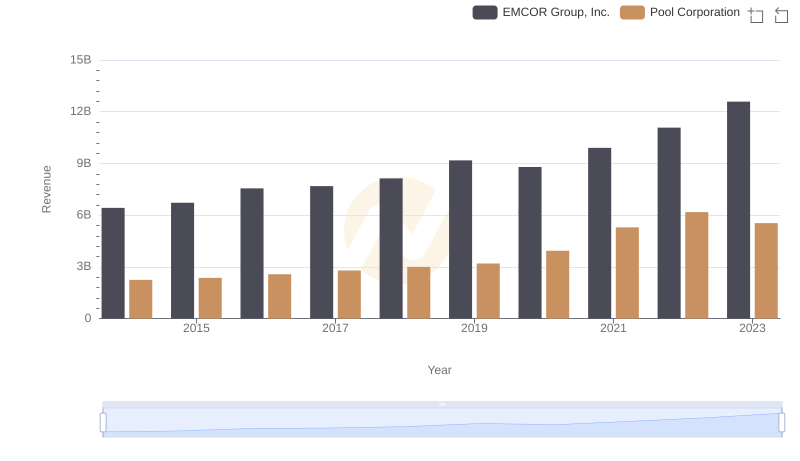
Annual Revenue Comparison: EMCOR Group, Inc. vs Pool Corporation
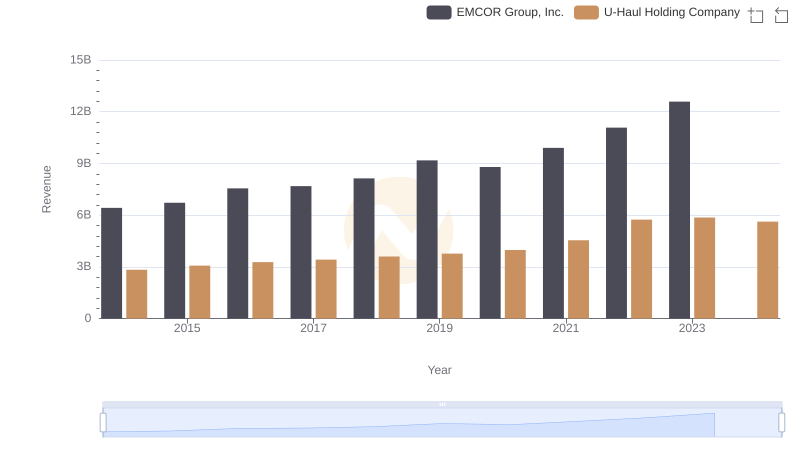
Comparing Revenue Performance: EMCOR Group, Inc. or U-Haul Holding Company?
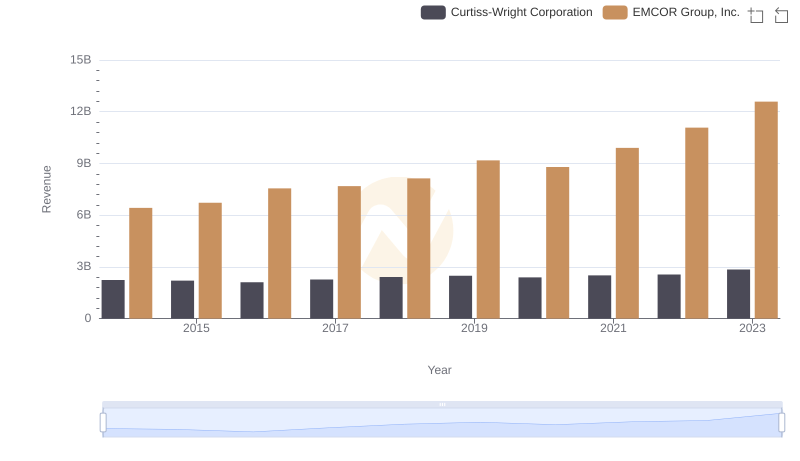
Comparing Revenue Performance: EMCOR Group, Inc. or Curtiss-Wright Corporation?
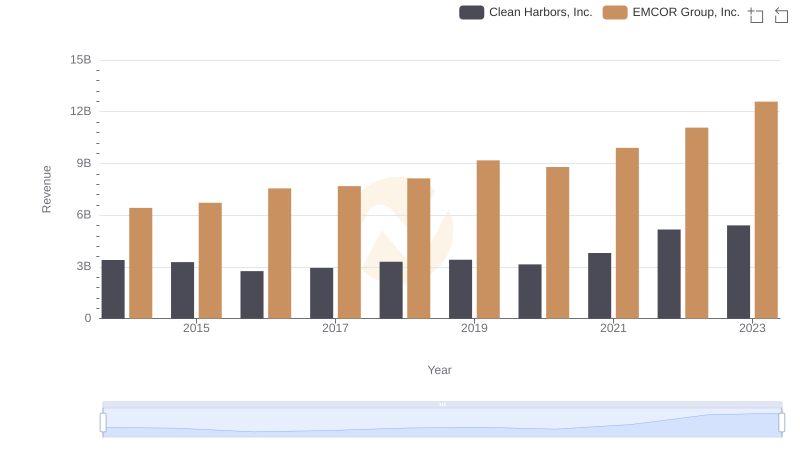
Breaking Down Revenue Trends: EMCOR Group, Inc. vs Clean Harbors, Inc.
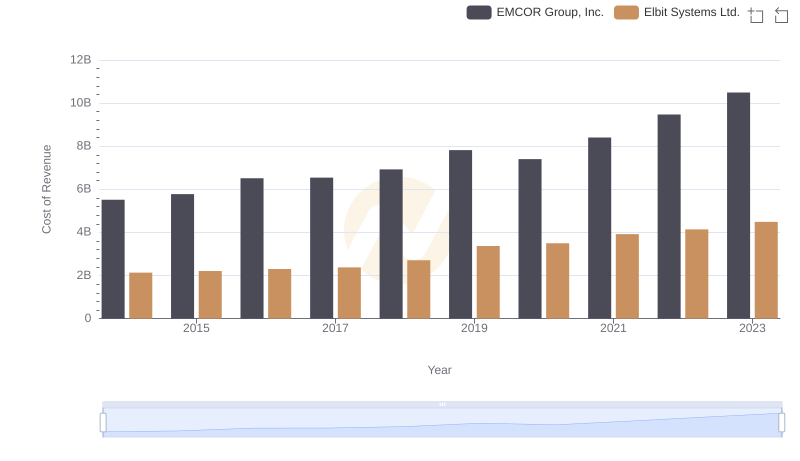
Cost of Revenue Trends: EMCOR Group, Inc. vs Elbit Systems Ltd.
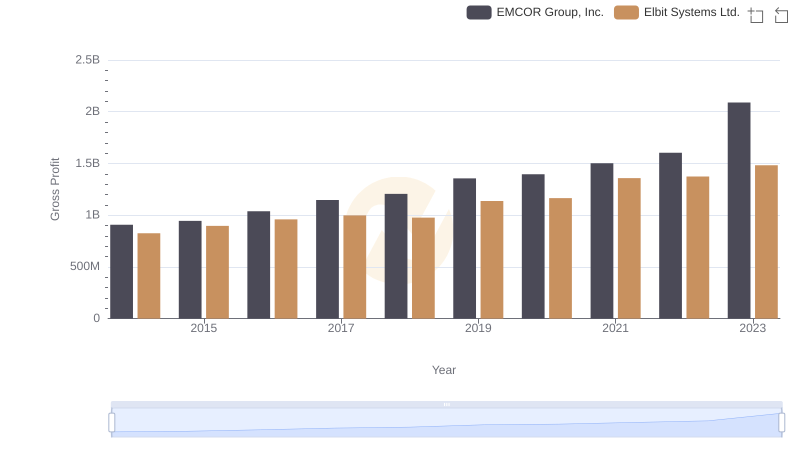
EMCOR Group, Inc. vs Elbit Systems Ltd.: A Gross Profit Performance Breakdown
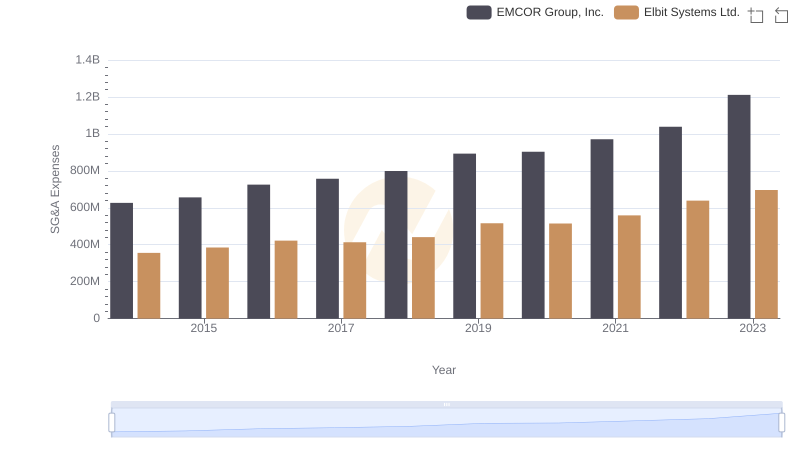
Breaking Down SG&A Expenses: EMCOR Group, Inc. vs Elbit Systems Ltd.
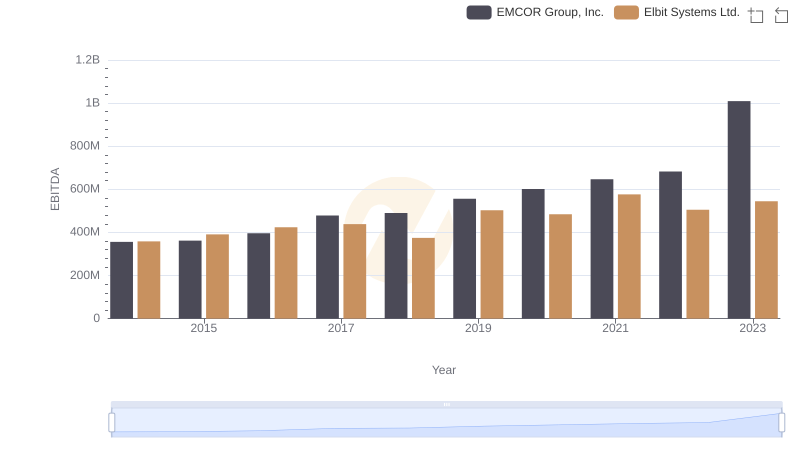
Professional EBITDA Benchmarking: EMCOR Group, Inc. vs Elbit Systems Ltd.