| __timestamp | EMCOR Group, Inc. | Nordson Corporation |
|---|---|---|
| Wednesday, January 1, 2014 | 6424965000 | 1704021000 |
| Thursday, January 1, 2015 | 6718726000 | 1688666000 |
| Friday, January 1, 2016 | 7551524000 | 1808994000 |
| Sunday, January 1, 2017 | 7686999000 | 2066982000 |
| Monday, January 1, 2018 | 8130631000 | 2254668000 |
| Tuesday, January 1, 2019 | 9174611000 | 2194226000 |
| Wednesday, January 1, 2020 | 8797061000 | 2121100000 |
| Friday, January 1, 2021 | 9903580000 | 2362209000 |
| Saturday, January 1, 2022 | 11076120000 | 2590278000 |
| Sunday, January 1, 2023 | 12582873000 | 2628632000 |
| Monday, January 1, 2024 | 2689921000 |
In pursuit of knowledge
In the competitive landscape of industrial services and manufacturing, EMCOR Group, Inc. and Nordson Corporation have been key players. Over the past decade, EMCOR has consistently outperformed Nordson in revenue generation. From 2014 to 2023, EMCOR's revenue surged by nearly 96%, peaking at approximately $12.6 billion in 2023. In contrast, Nordson's revenue grew by about 54% during the same period, reaching around $2.6 billion.
EMCOR's revenue growth reflects its strategic expansion and diversification in the construction and facilities services sectors. Meanwhile, Nordson, a leader in precision technology, has shown steady growth, albeit at a slower pace. The data highlights EMCOR's dominance, with its revenue consistently being 4 to 5 times that of Nordson's.
As we move into 2024, Nordson's data is incomplete, leaving room for speculation on its future trajectory. However, EMCOR's absence in 2024 data suggests a potential shift or delay in reporting. This revenue analysis underscores the dynamic nature of the industrial sector and the importance of strategic growth initiatives.
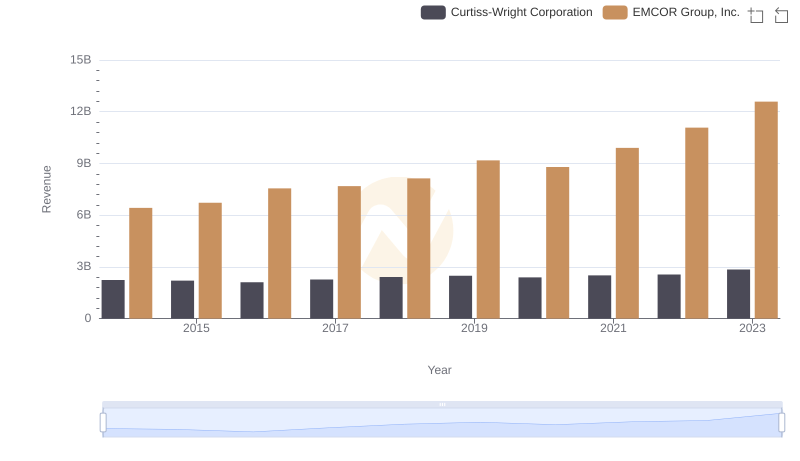
Comparing Revenue Performance: EMCOR Group, Inc. or Curtiss-Wright Corporation?
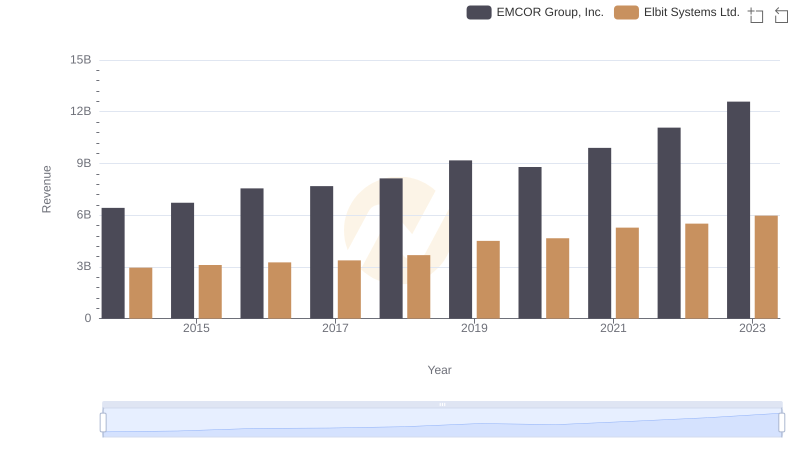
Comparing Revenue Performance: EMCOR Group, Inc. or Elbit Systems Ltd.?
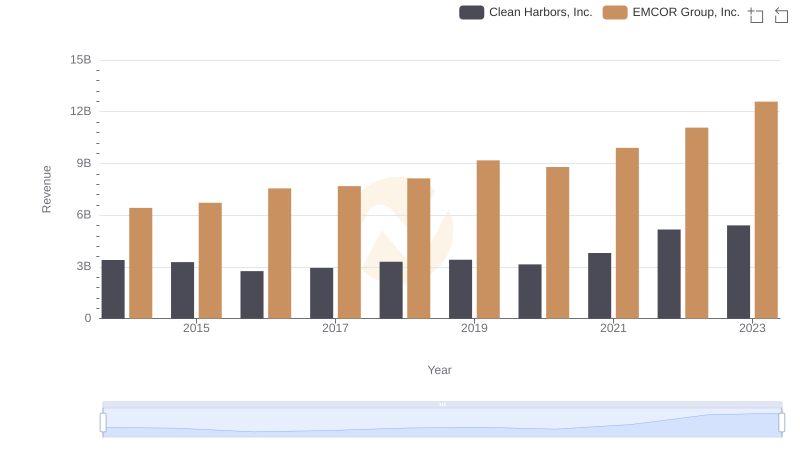
Breaking Down Revenue Trends: EMCOR Group, Inc. vs Clean Harbors, Inc.
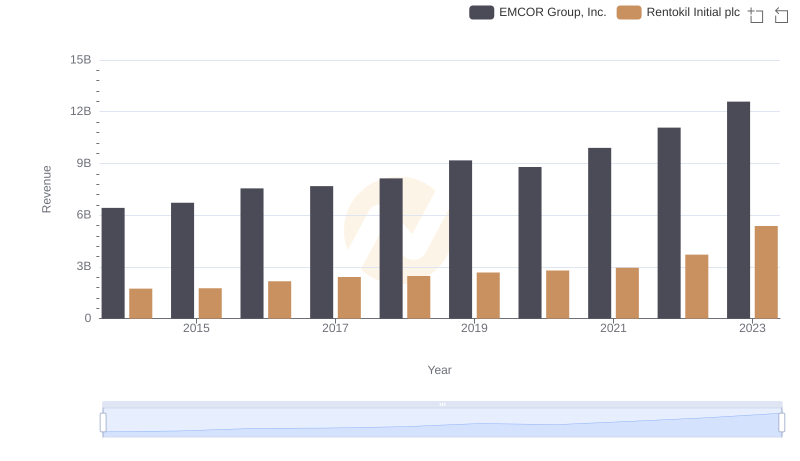
Who Generates More Revenue? EMCOR Group, Inc. or Rentokil Initial plc
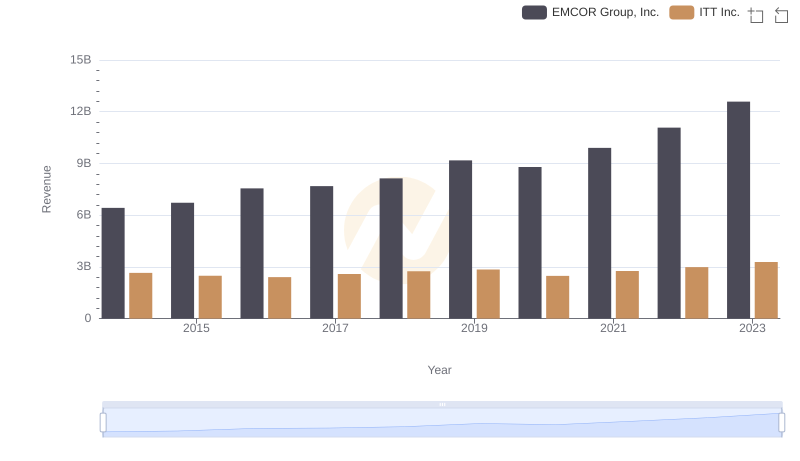
EMCOR Group, Inc. vs ITT Inc.: Annual Revenue Growth Compared
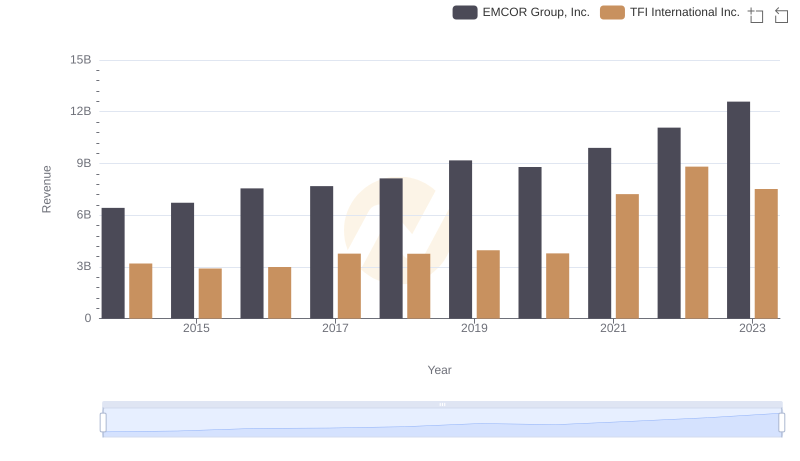
Comparing Revenue Performance: EMCOR Group, Inc. or TFI International Inc.?
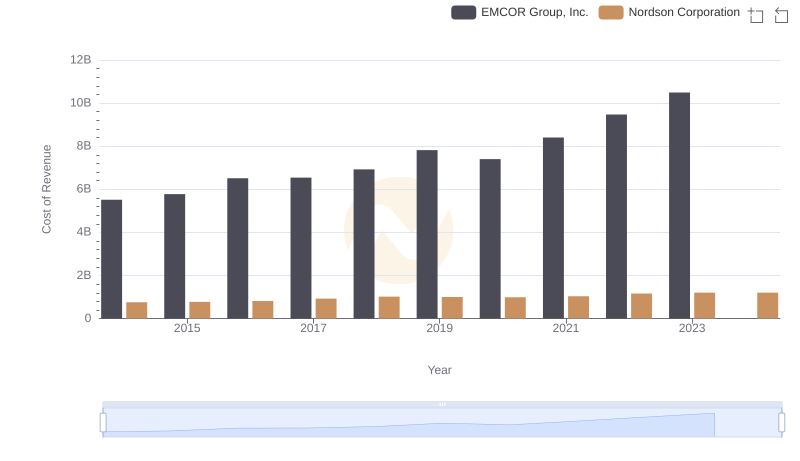
Cost of Revenue: Key Insights for EMCOR Group, Inc. and Nordson Corporation
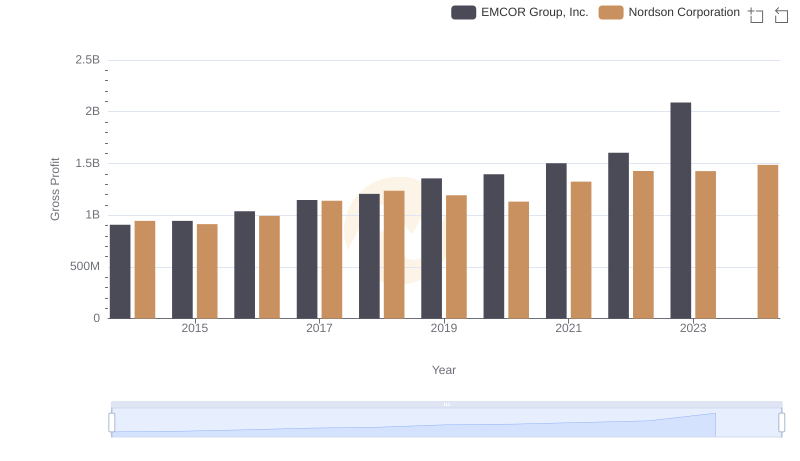
Key Insights on Gross Profit: EMCOR Group, Inc. vs Nordson Corporation
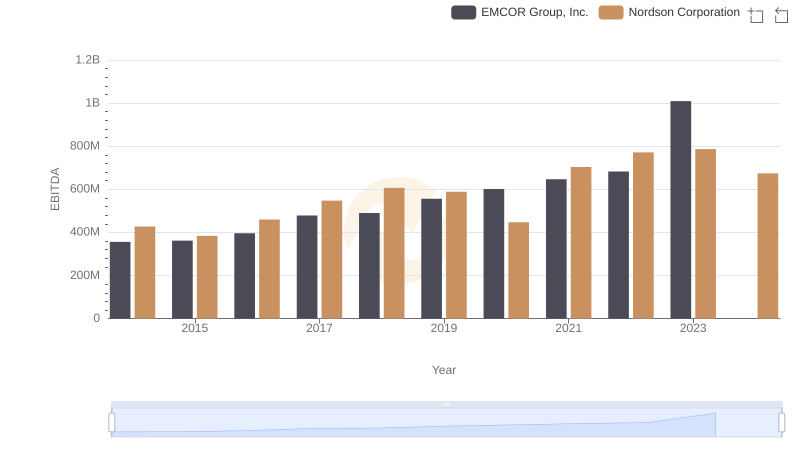
EBITDA Analysis: Evaluating EMCOR Group, Inc. Against Nordson Corporation