| __timestamp | EMCOR Group, Inc. | ITT Inc. |
|---|---|---|
| Wednesday, January 1, 2014 | 6424965000 | 2654600000 |
| Thursday, January 1, 2015 | 6718726000 | 2485600000 |
| Friday, January 1, 2016 | 7551524000 | 2405400000 |
| Sunday, January 1, 2017 | 7686999000 | 2585300000 |
| Monday, January 1, 2018 | 8130631000 | 2745100000 |
| Tuesday, January 1, 2019 | 9174611000 | 2846400000 |
| Wednesday, January 1, 2020 | 8797061000 | 2477800000 |
| Friday, January 1, 2021 | 9903580000 | 2765000000 |
| Saturday, January 1, 2022 | 11076120000 | 2987700000 |
| Sunday, January 1, 2023 | 12582873000 | 3283000000 |
| Monday, January 1, 2024 | 3630700000 |
Unveiling the hidden dimensions of data
In the competitive landscape of industrial services and manufacturing, EMCOR Group, Inc. and ITT Inc. have carved out significant niches. Over the past decade, EMCOR has demonstrated a robust growth trajectory, with its revenue surging by nearly 96% from 2014 to 2023. This impressive growth reflects EMCOR's strategic expansions and adaptability in a dynamic market. In contrast, ITT Inc. has maintained a steady pace, with a 24% increase in revenue over the same period, showcasing its resilience and consistent performance.
The year 2023 marks a significant milestone, with EMCOR's revenue reaching approximately $12.6 billion, nearly quadruple that of ITT's $3.3 billion. This comparison highlights the diverse strategies and market positions of these two industry leaders. As we look to the future, the question remains: how will these companies continue to evolve and compete in an ever-changing economic landscape?
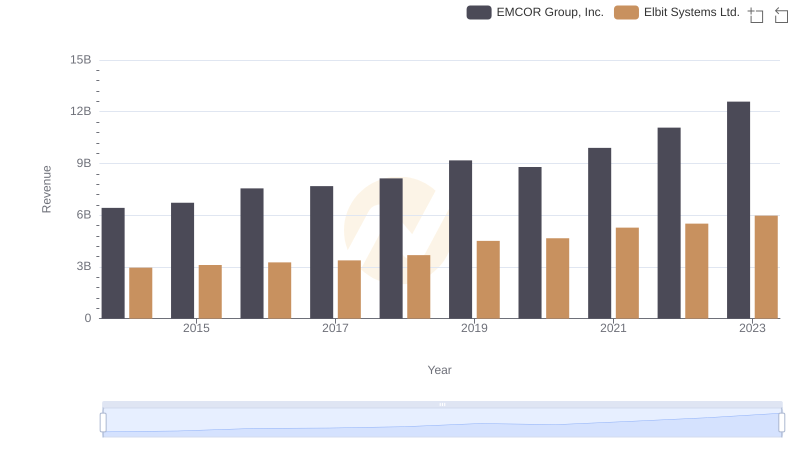
Comparing Revenue Performance: EMCOR Group, Inc. or Elbit Systems Ltd.?
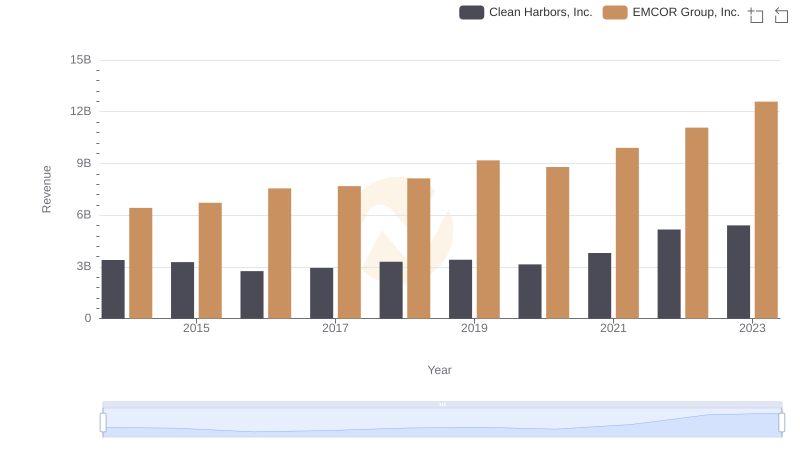
Breaking Down Revenue Trends: EMCOR Group, Inc. vs Clean Harbors, Inc.
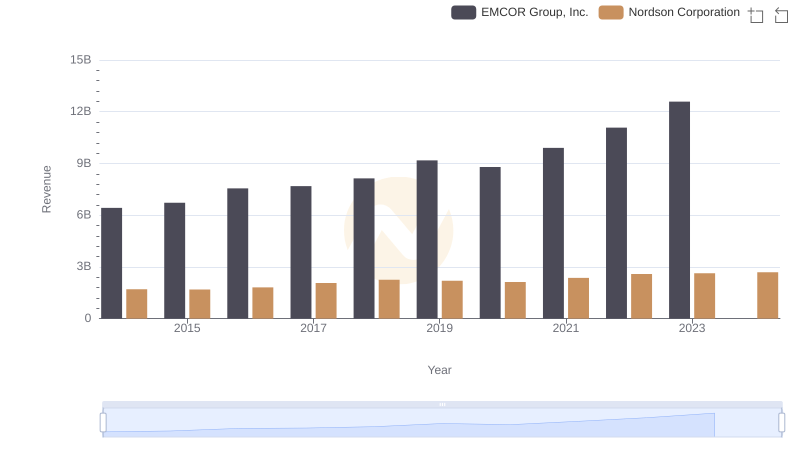
Who Generates More Revenue? EMCOR Group, Inc. or Nordson Corporation
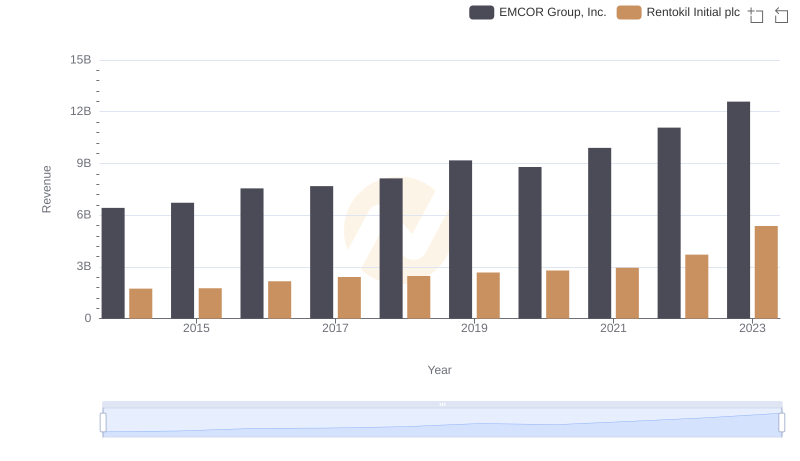
Who Generates More Revenue? EMCOR Group, Inc. or Rentokil Initial plc
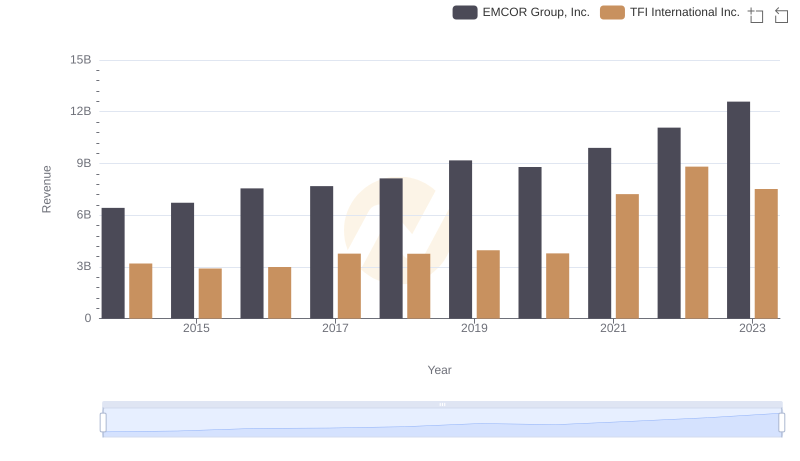
Comparing Revenue Performance: EMCOR Group, Inc. or TFI International Inc.?
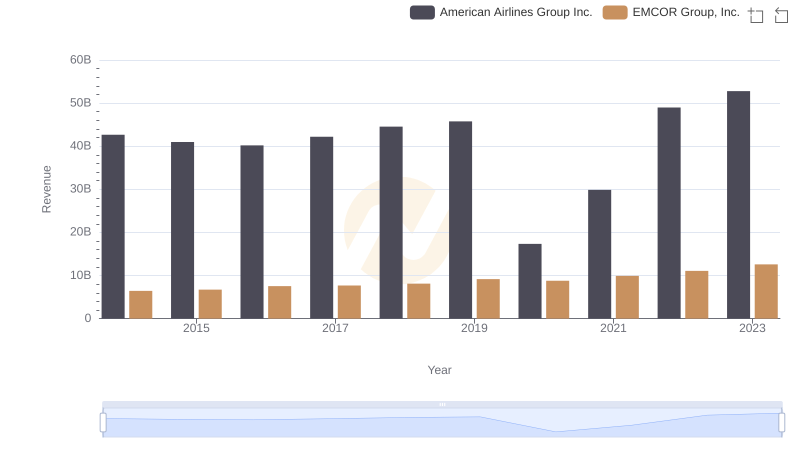
EMCOR Group, Inc. vs American Airlines Group Inc.: Examining Key Revenue Metrics
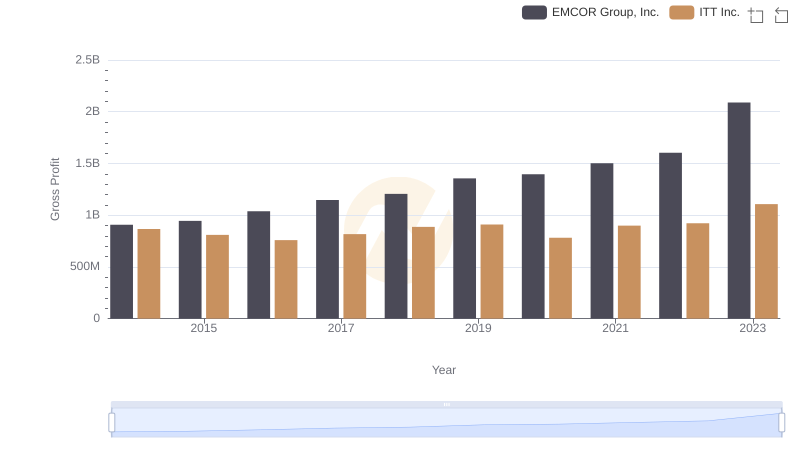
Who Generates Higher Gross Profit? EMCOR Group, Inc. or ITT Inc.
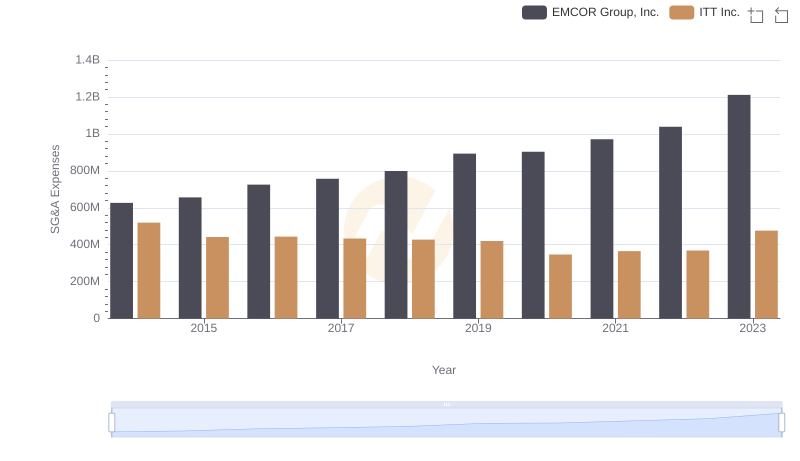
EMCOR Group, Inc. vs ITT Inc.: SG&A Expense Trends
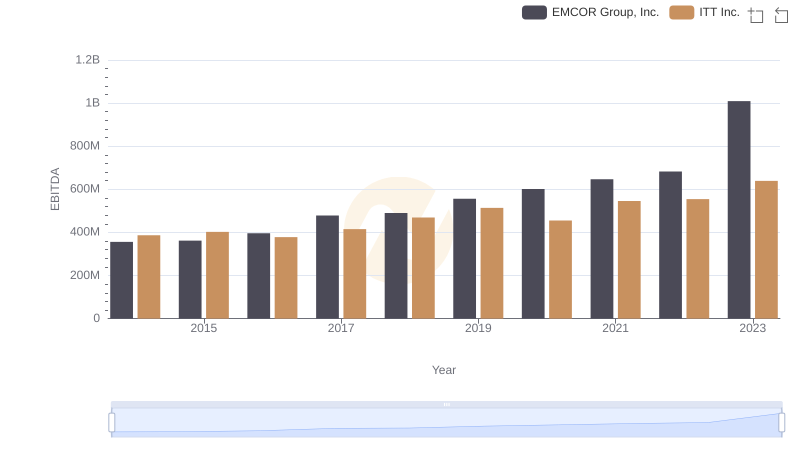
A Side-by-Side Analysis of EBITDA: EMCOR Group, Inc. and ITT Inc.