| __timestamp | CNH Industrial N.V. | Waste Connections, Inc. |
|---|---|---|
| Wednesday, January 1, 2014 | 7021000000 | 940778000 |
| Thursday, January 1, 2015 | 5555000000 | 939878000 |
| Friday, January 1, 2016 | 5333000000 | 1418151000 |
| Sunday, January 1, 2017 | 5740000000 | 1925713000 |
| Monday, January 1, 2018 | 6748000000 | 2057237000 |
| Tuesday, January 1, 2019 | 6247000000 | 2189922000 |
| Wednesday, January 1, 2020 | 4705000000 | 2169182000 |
| Friday, January 1, 2021 | 7477000000 | 2497287000 |
| Saturday, January 1, 2022 | 6754000000 | 2875847000 |
| Sunday, January 1, 2023 | 7889000000 | 3277438000 |
| Monday, January 1, 2024 | 3727885000 |
Unleashing insights
In the competitive landscape of industrial giants, Waste Connections, Inc. and CNH Industrial N.V. have been vying for supremacy in gross profit generation. Over the past decade, CNH Industrial N.V. has consistently outperformed Waste Connections, Inc., boasting an average gross profit nearly three times higher. However, the gap has been narrowing. In 2014, CNH Industrial N.V. generated approximately 7.0 billion in gross profit, while Waste Connections, Inc. lagged behind with just under 1.0 billion. Fast forward to 2023, and Waste Connections, Inc. has seen a remarkable growth, increasing its gross profit by over 250% to reach 3.3 billion, while CNH Industrial N.V. grew by about 12% to 7.9 billion. This trend highlights Waste Connections, Inc.'s aggressive growth strategy and its potential to challenge CNH Industrial N.V.'s dominance in the near future.
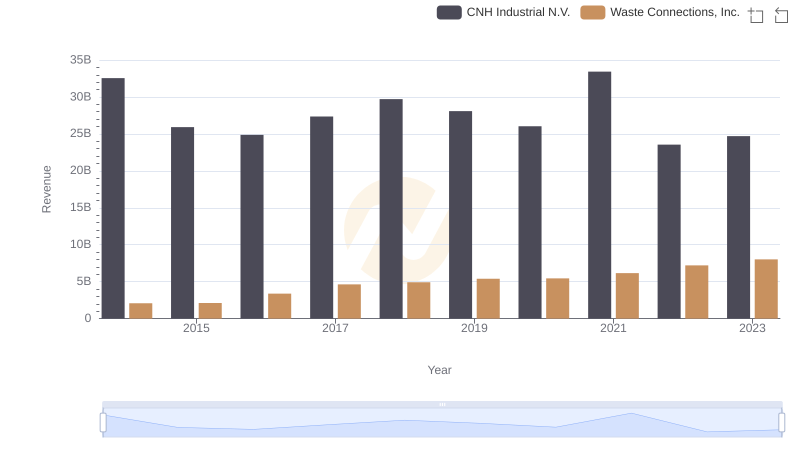
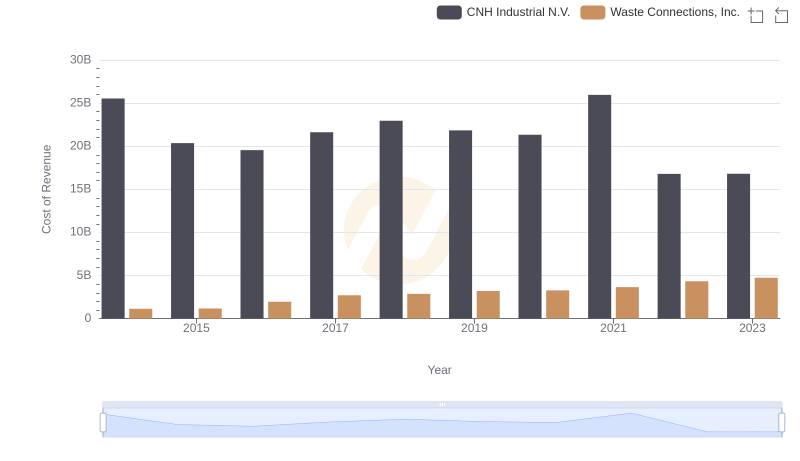
Revenue Showdown: Waste Connections, Inc. vs CNH Industrial N.V.
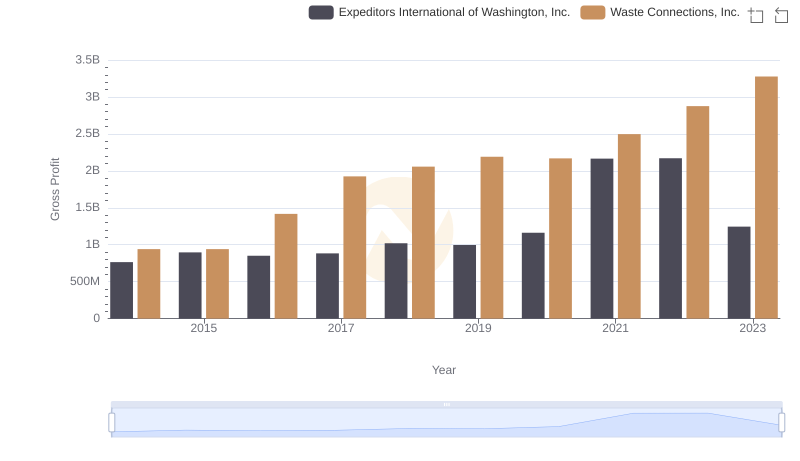
Gross Profit Trends Compared: Waste Connections, Inc. vs Expeditors International of Washington, Inc.
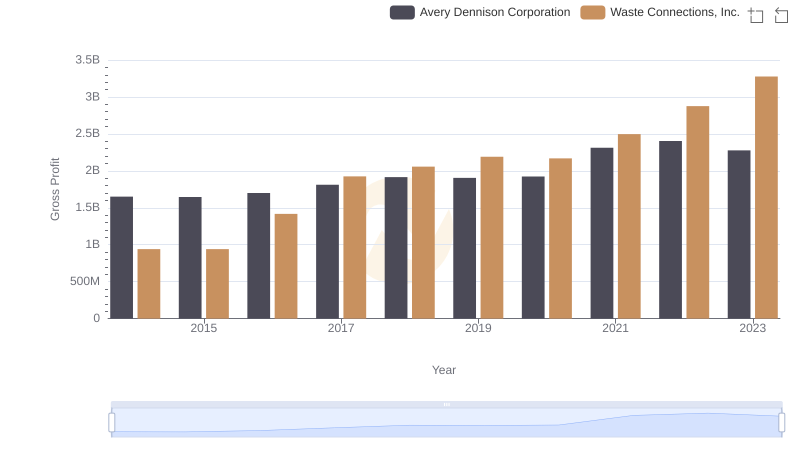
Gross Profit Comparison: Waste Connections, Inc. and Avery Dennison Corporation Trends
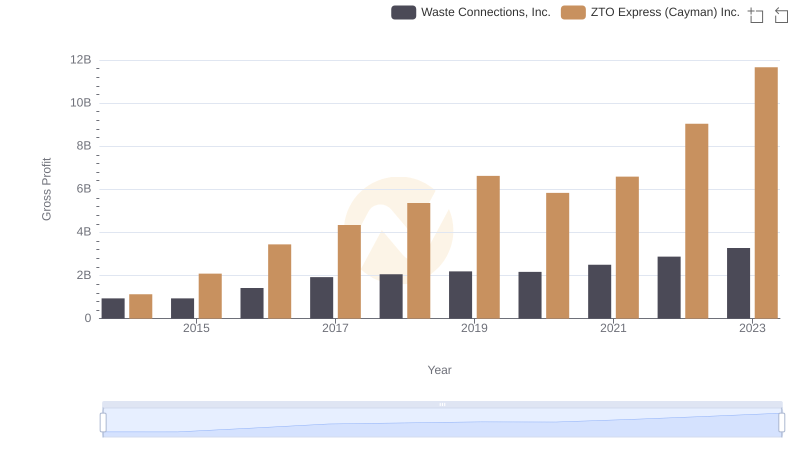
Waste Connections, Inc. vs ZTO Express (Cayman) Inc.: A Gross Profit Performance Breakdown
Cost Insights: Breaking Down Waste Connections, Inc. and CNH Industrial N.V.'s Expenses
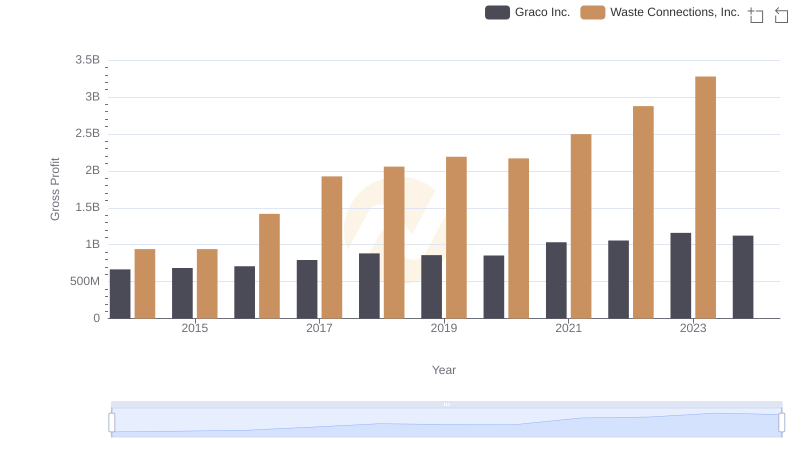
Waste Connections, Inc. vs Graco Inc.: A Gross Profit Performance Breakdown
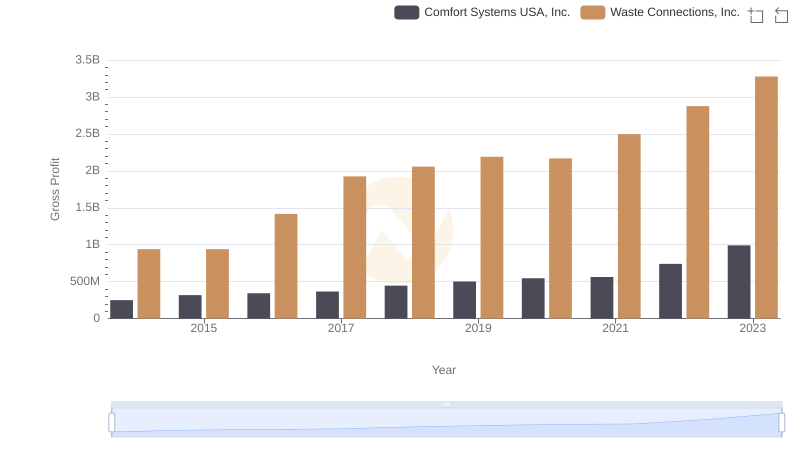
Gross Profit Trends Compared: Waste Connections, Inc. vs Comfort Systems USA, Inc.
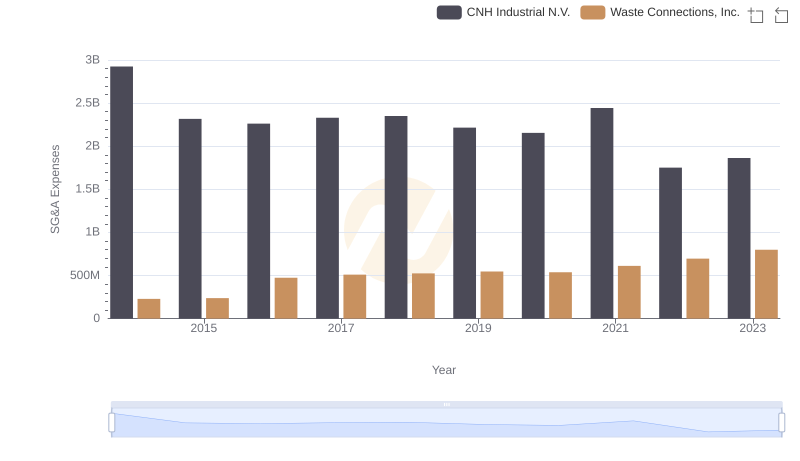
Waste Connections, Inc. vs CNH Industrial N.V.: SG&A Expense Trends
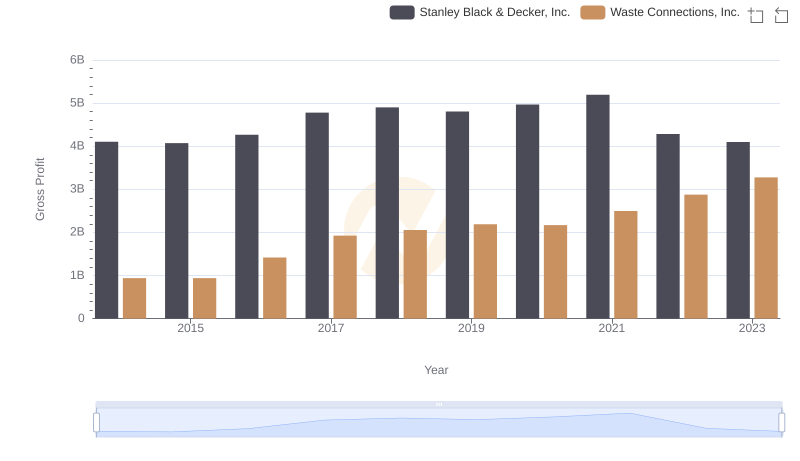
Gross Profit Analysis: Comparing Waste Connections, Inc. and Stanley Black & Decker, Inc.

Key Insights on Gross Profit: Waste Connections, Inc. vs Pool Corporation

Waste Connections, Inc. and AECOM: A Detailed Gross Profit Analysis
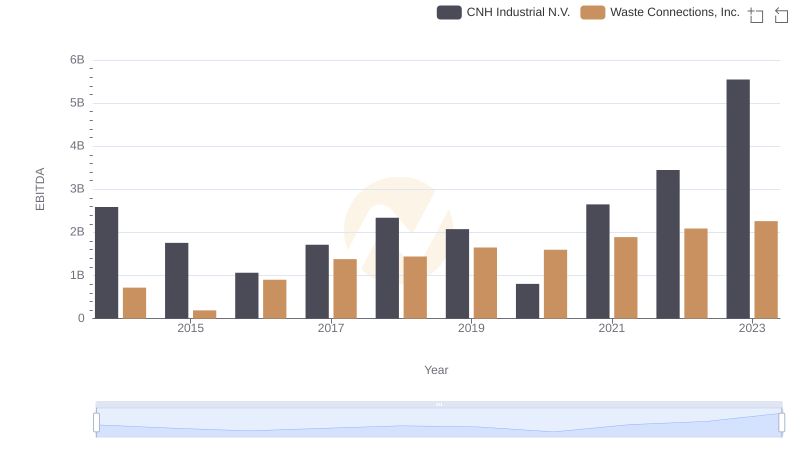
EBITDA Metrics Evaluated: Waste Connections, Inc. vs CNH Industrial N.V.