| __timestamp | Comfort Systems USA, Inc. | Waste Connections, Inc. |
|---|---|---|
| Wednesday, January 1, 2014 | 249771000 | 940778000 |
| Thursday, January 1, 2015 | 318129000 | 939878000 |
| Friday, January 1, 2016 | 344009000 | 1418151000 |
| Sunday, January 1, 2017 | 366281000 | 1925713000 |
| Monday, January 1, 2018 | 446279000 | 2057237000 |
| Tuesday, January 1, 2019 | 501943000 | 2189922000 |
| Wednesday, January 1, 2020 | 546983000 | 2169182000 |
| Friday, January 1, 2021 | 563207000 | 2497287000 |
| Saturday, January 1, 2022 | 741608000 | 2875847000 |
| Sunday, January 1, 2023 | 990509000 | 3277438000 |
| Monday, January 1, 2024 | 3727885000 |
Unleashing the power of data
In the ever-evolving landscape of the U.S. stock market, Waste Connections, Inc. and Comfort Systems USA, Inc. have showcased intriguing gross profit trends over the past decade. From 2014 to 2023, Waste Connections, Inc. has consistently outperformed Comfort Systems USA, Inc., with a gross profit increase of approximately 248%. In contrast, Comfort Systems USA, Inc. has seen a commendable growth of around 296% during the same period.
Waste Connections, Inc. started with a gross profit of nearly 940 million in 2014, reaching over 3.2 billion by 2023. Meanwhile, Comfort Systems USA, Inc. began with a modest 250 million, climbing to nearly 990 million. This growth reflects the companies' strategic adaptations and market positioning. As we look to the future, these trends offer valuable insights into the resilience and potential of these industry players.
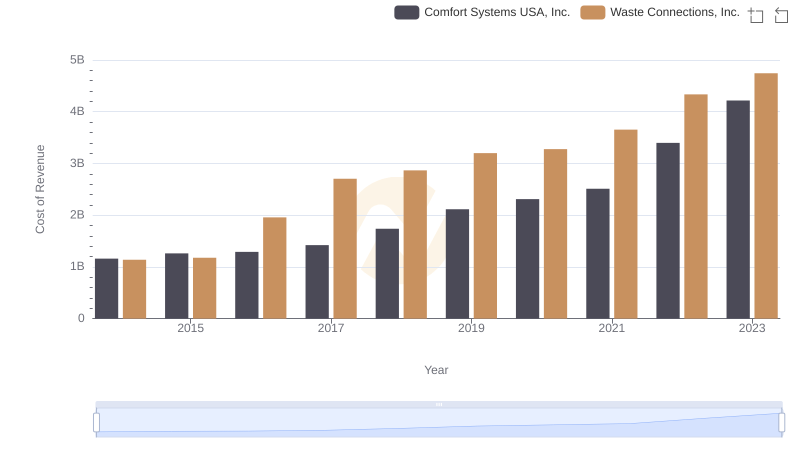
Cost of Revenue Comparison: Waste Connections, Inc. vs Comfort Systems USA, Inc.
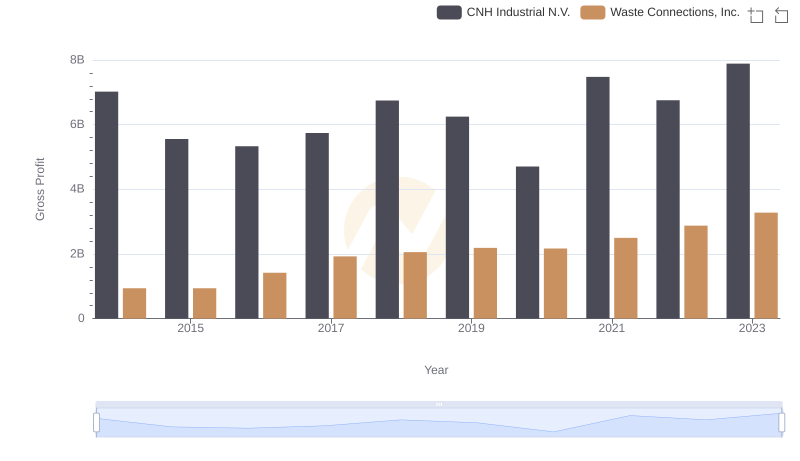
Who Generates Higher Gross Profit? Waste Connections, Inc. or CNH Industrial N.V.
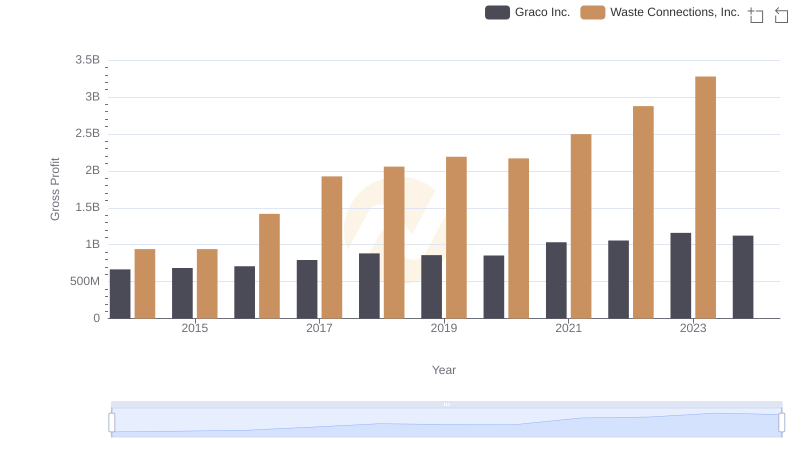
Waste Connections, Inc. vs Graco Inc.: A Gross Profit Performance Breakdown
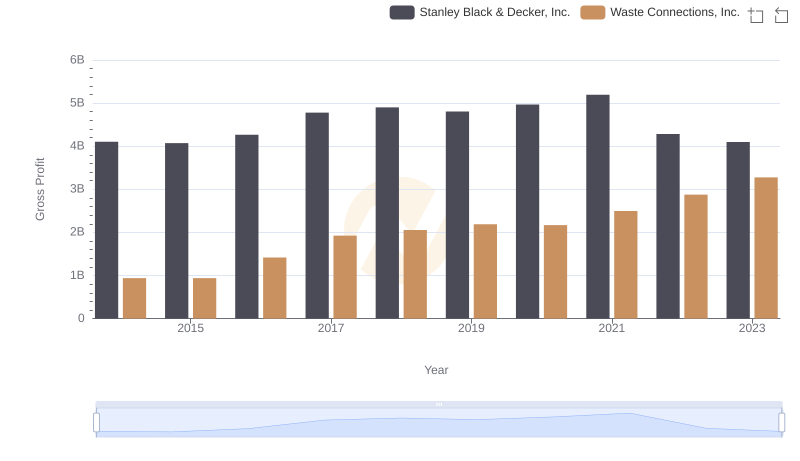
Gross Profit Analysis: Comparing Waste Connections, Inc. and Stanley Black & Decker, Inc.

Key Insights on Gross Profit: Waste Connections, Inc. vs Pool Corporation

Waste Connections, Inc. and AECOM: A Detailed Gross Profit Analysis
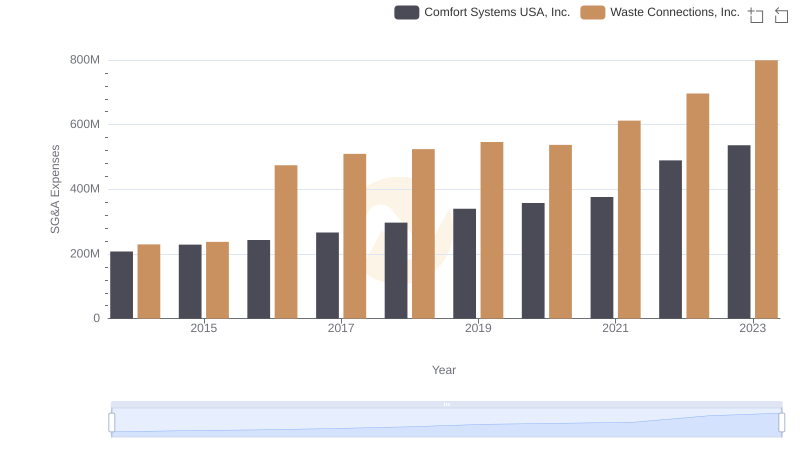
Operational Costs Compared: SG&A Analysis of Waste Connections, Inc. and Comfort Systems USA, Inc.
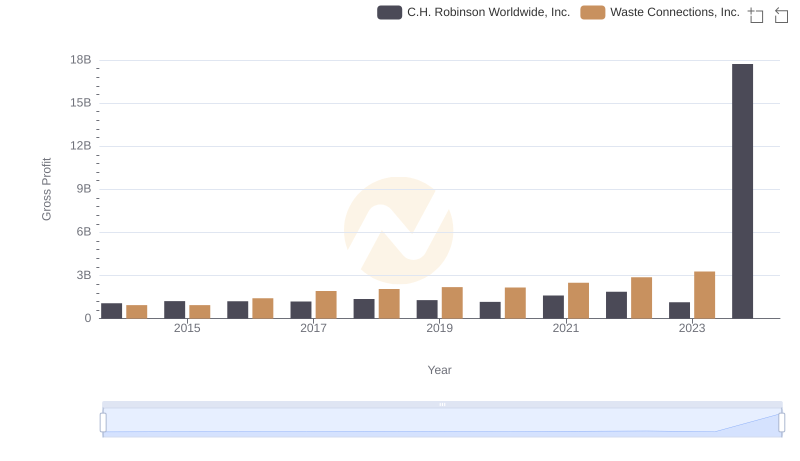
Key Insights on Gross Profit: Waste Connections, Inc. vs C.H. Robinson Worldwide, Inc.
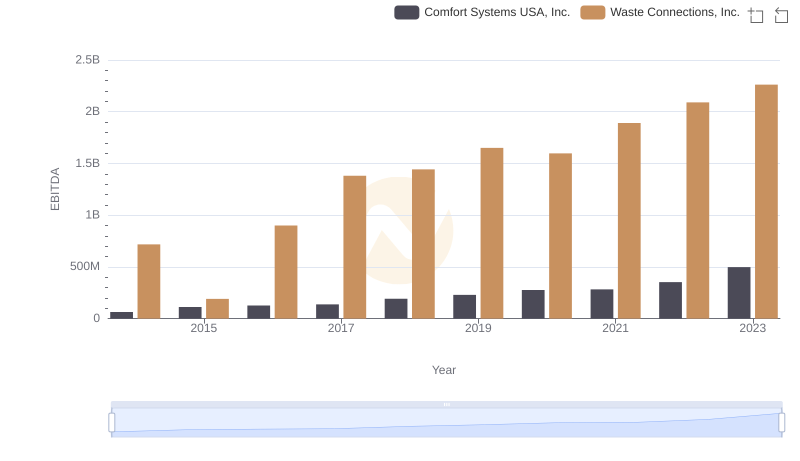
Waste Connections, Inc. vs Comfort Systems USA, Inc.: In-Depth EBITDA Performance Comparison