| __timestamp | AECOM | Waste Connections, Inc. |
|---|---|---|
| Wednesday, January 1, 2014 | 403176000 | 940778000 |
| Thursday, January 1, 2015 | 535188000 | 939878000 |
| Friday, January 1, 2016 | 642824000 | 1418151000 |
| Sunday, January 1, 2017 | 683720000 | 1925713000 |
| Monday, January 1, 2018 | 650649000 | 2057237000 |
| Tuesday, January 1, 2019 | 813445000 | 2189922000 |
| Wednesday, January 1, 2020 | 709560000 | 2169182000 |
| Friday, January 1, 2021 | 798421000 | 2497287000 |
| Saturday, January 1, 2022 | 847974000 | 2875847000 |
| Sunday, January 1, 2023 | 945465000 | 3277438000 |
| Monday, January 1, 2024 | 1084341000 | 3727885000 |
Cracking the code
In the ever-evolving landscape of industrial services, Waste Connections, Inc. and AECOM have emerged as formidable players. Over the past decade, Waste Connections, Inc. has consistently outperformed AECOM in terms of gross profit, showcasing a robust growth trajectory. From 2014 to 2023, Waste Connections, Inc. saw its gross profit soar by approximately 248%, peaking at an impressive $3.28 billion in 2023. In contrast, AECOM's growth, while steady, was more modest, with a 135% increase over the same period, reaching $1.08 billion in 2024.
The data reveals a compelling narrative of strategic growth and market positioning. Waste Connections, Inc.'s aggressive expansion and operational efficiency have been key drivers of its success. Meanwhile, AECOM's steady climb reflects its resilience and adaptability in a competitive market. As we look to the future, these trends offer valuable insights into the dynamics of industrial service giants.
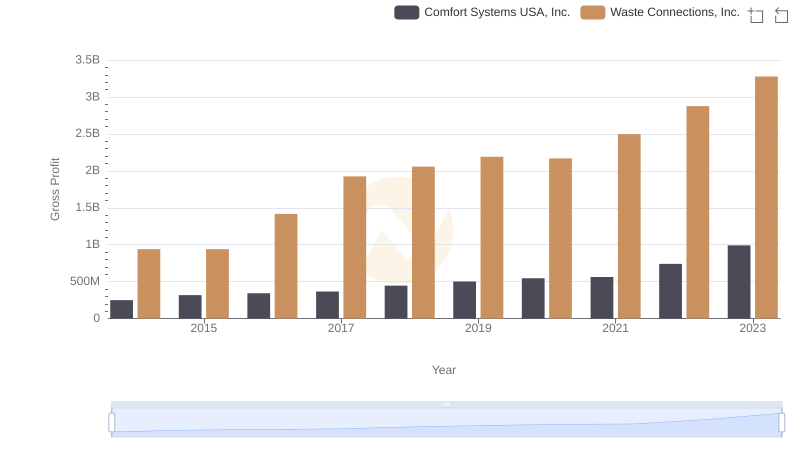
Gross Profit Trends Compared: Waste Connections, Inc. vs Comfort Systems USA, Inc.
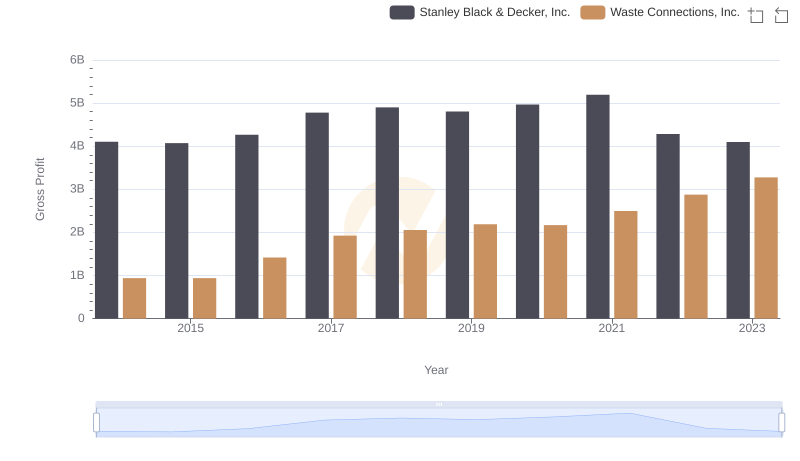
Gross Profit Analysis: Comparing Waste Connections, Inc. and Stanley Black & Decker, Inc.

Key Insights on Gross Profit: Waste Connections, Inc. vs Pool Corporation
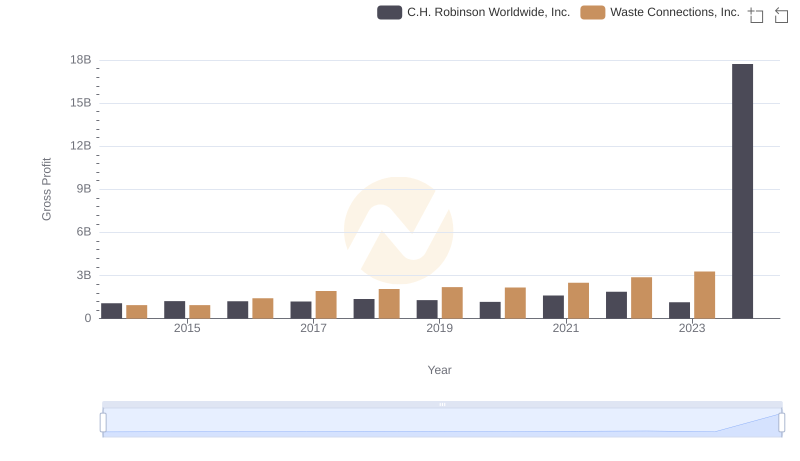
Key Insights on Gross Profit: Waste Connections, Inc. vs C.H. Robinson Worldwide, Inc.
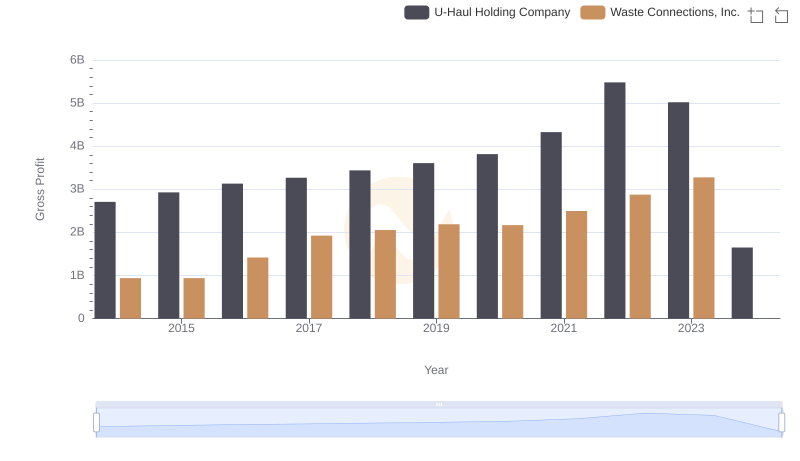
Key Insights on Gross Profit: Waste Connections, Inc. vs U-Haul Holding Company
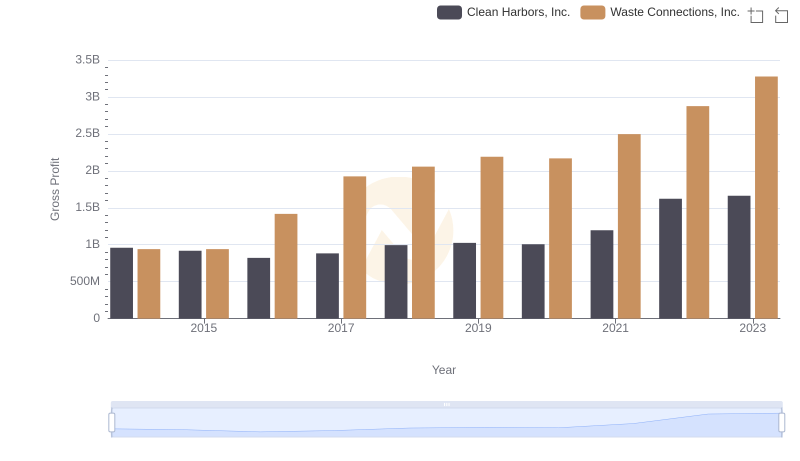
Waste Connections, Inc. and Clean Harbors, Inc.: A Detailed Gross Profit Analysis
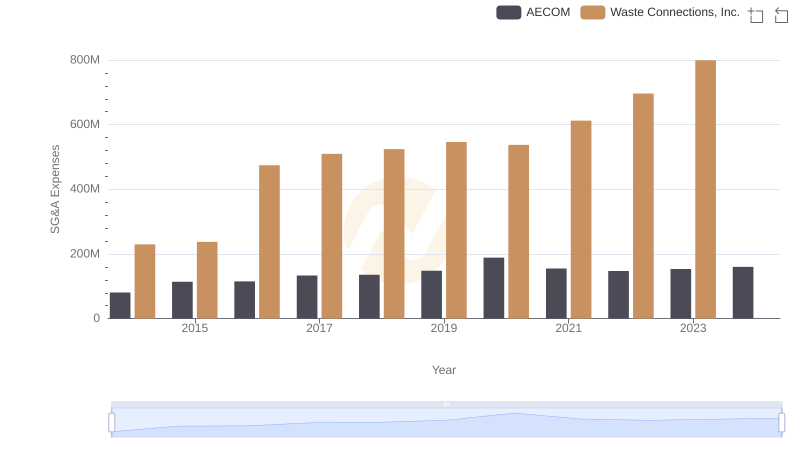
Comparing SG&A Expenses: Waste Connections, Inc. vs AECOM Trends and Insights
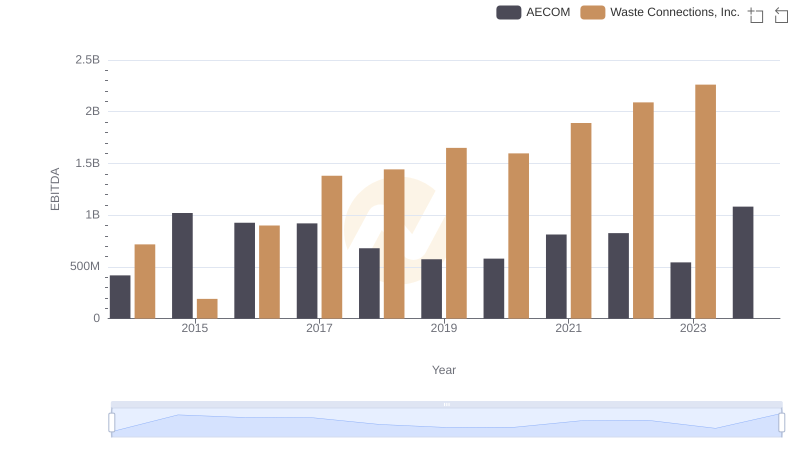
Professional EBITDA Benchmarking: Waste Connections, Inc. vs AECOM