| __timestamp | CNH Industrial N.V. | Waste Connections, Inc. |
|---|---|---|
| Wednesday, January 1, 2014 | 2925000000 | 229474000 |
| Thursday, January 1, 2015 | 2317000000 | 237484000 |
| Friday, January 1, 2016 | 2262000000 | 474263000 |
| Sunday, January 1, 2017 | 2330000000 | 509638000 |
| Monday, January 1, 2018 | 2351000000 | 524388000 |
| Tuesday, January 1, 2019 | 2216000000 | 546278000 |
| Wednesday, January 1, 2020 | 2155000000 | 537632000 |
| Friday, January 1, 2021 | 2443000000 | 612337000 |
| Saturday, January 1, 2022 | 1752000000 | 696467000 |
| Sunday, January 1, 2023 | 1863000000 | 799119000 |
| Monday, January 1, 2024 | 883445000 |
Unleashing the power of data
In the ever-evolving landscape of corporate finance, understanding the trends in Selling, General, and Administrative (SG&A) expenses is crucial for investors and analysts alike. This chart provides a decade-long comparison of SG&A expenses between Waste Connections, Inc. and CNH Industrial N.V., two giants in their respective industries.
From 2014 to 2023, Waste Connections, Inc. has shown a remarkable upward trend, with SG&A expenses increasing by approximately 248%. This growth reflects the company's strategic investments and expansion efforts. In contrast, CNH Industrial N.V. experienced a 36% decline in SG&A expenses over the same period, indicating a focus on cost optimization and efficiency.
The data highlights a pivotal shift in corporate strategies, with Waste Connections, Inc. prioritizing growth and CNH Industrial N.V. emphasizing cost control. These insights offer a window into the financial health and strategic direction of these industry leaders.
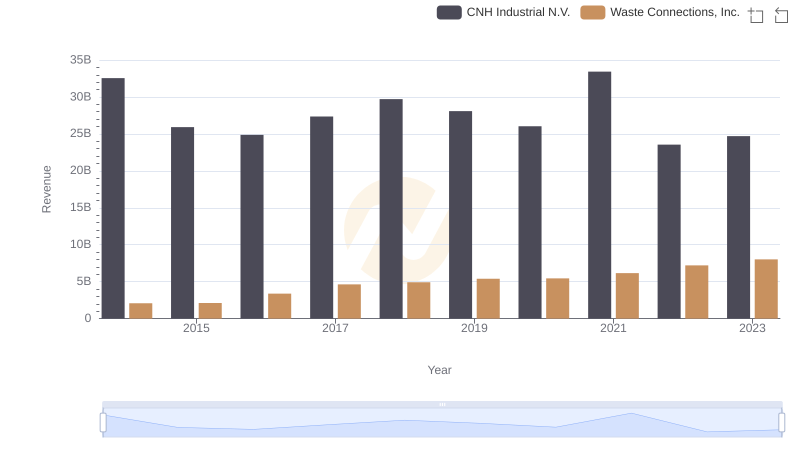
Revenue Showdown: Waste Connections, Inc. vs CNH Industrial N.V.
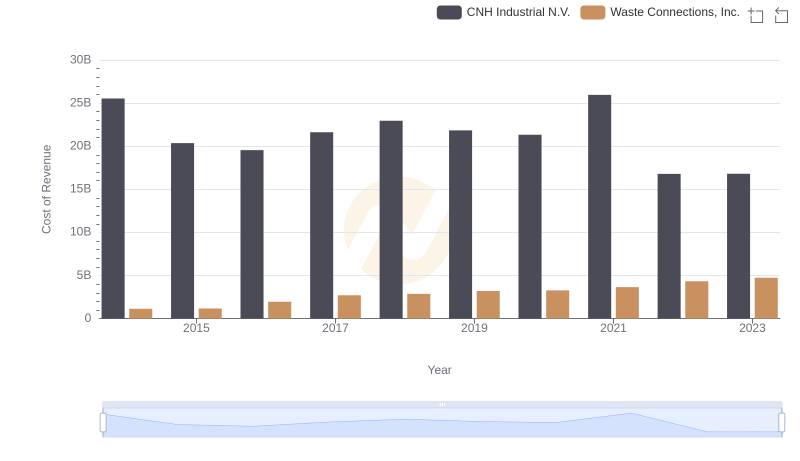
Cost Insights: Breaking Down Waste Connections, Inc. and CNH Industrial N.V.'s Expenses
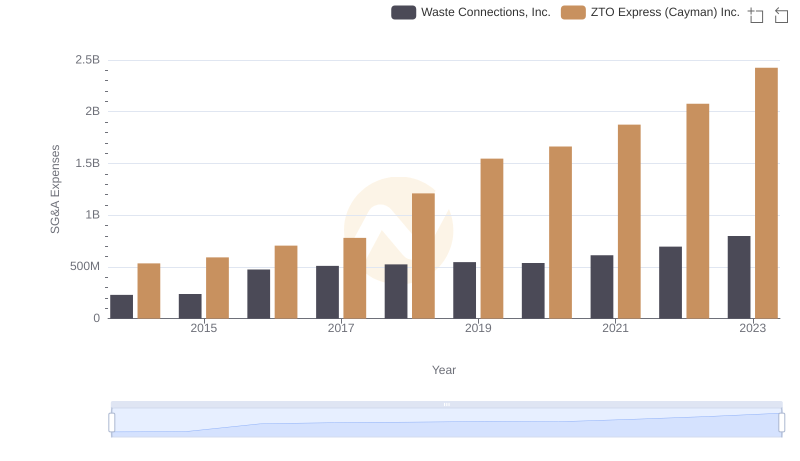
Waste Connections, Inc. vs ZTO Express (Cayman) Inc.: SG&A Expense Trends
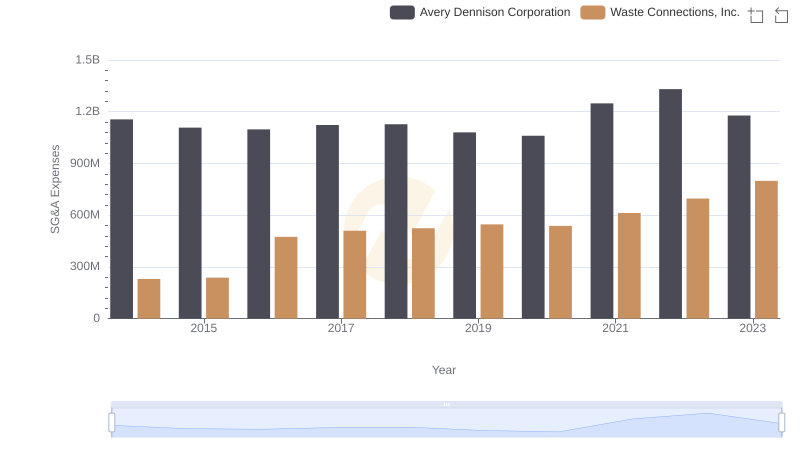
Breaking Down SG&A Expenses: Waste Connections, Inc. vs Avery Dennison Corporation
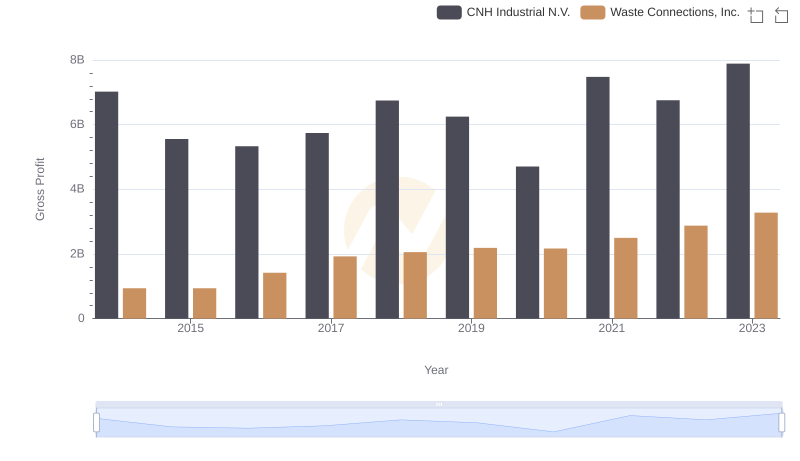
Who Generates Higher Gross Profit? Waste Connections, Inc. or CNH Industrial N.V.
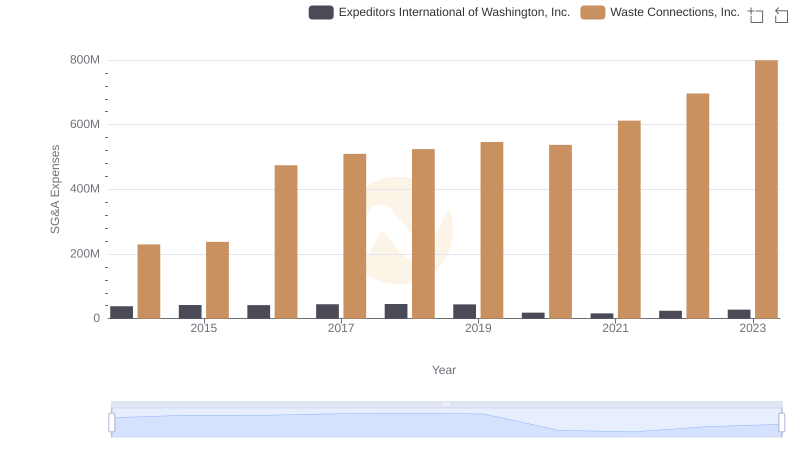
Breaking Down SG&A Expenses: Waste Connections, Inc. vs Expeditors International of Washington, Inc.
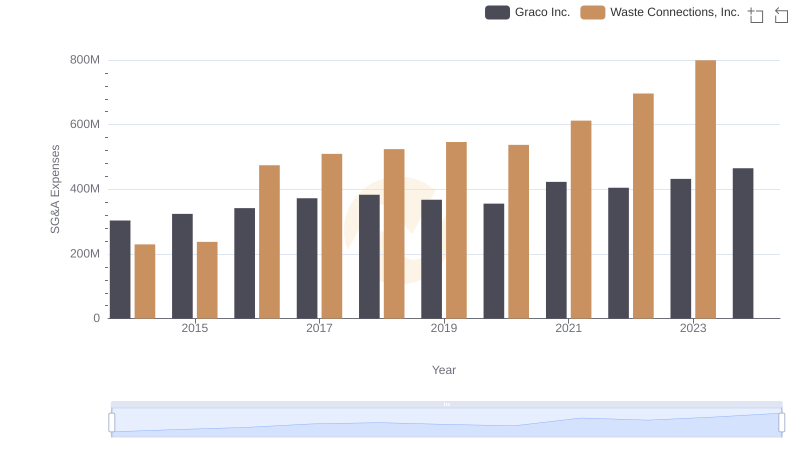
Operational Costs Compared: SG&A Analysis of Waste Connections, Inc. and Graco Inc.
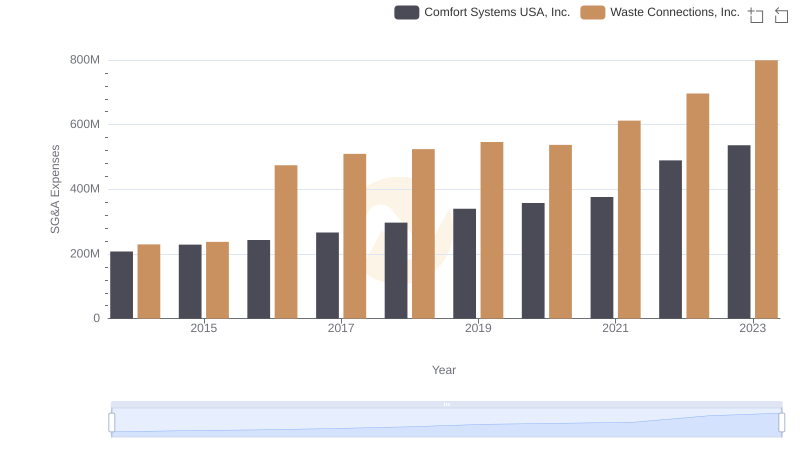
Operational Costs Compared: SG&A Analysis of Waste Connections, Inc. and Comfort Systems USA, Inc.
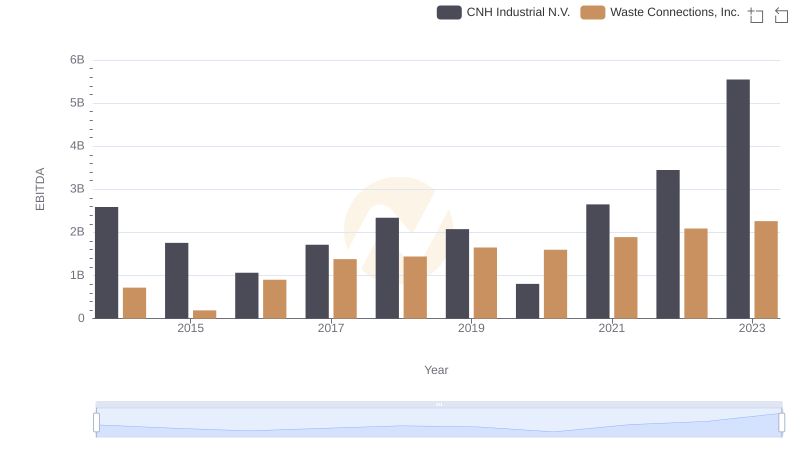
EBITDA Metrics Evaluated: Waste Connections, Inc. vs CNH Industrial N.V.
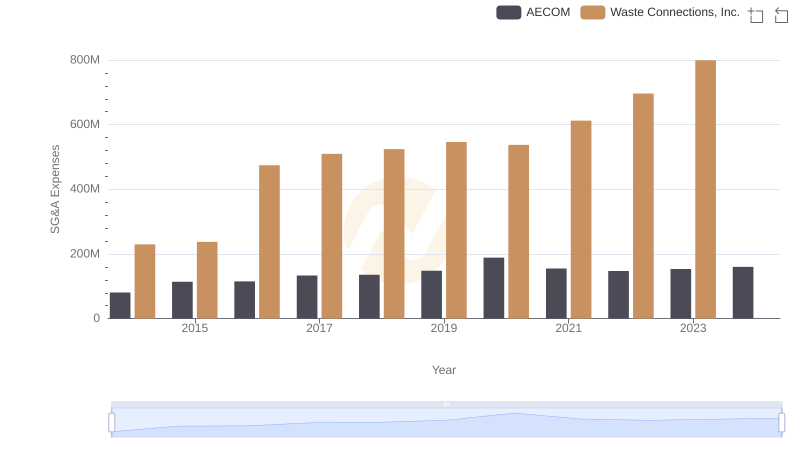
Comparing SG&A Expenses: Waste Connections, Inc. vs AECOM Trends and Insights