| __timestamp | Expeditors International of Washington, Inc. | Waste Connections, Inc. |
|---|---|---|
| Wednesday, January 1, 2014 | 763996000 | 940778000 |
| Thursday, January 1, 2015 | 895784000 | 939878000 |
| Friday, January 1, 2016 | 850793000 | 1418151000 |
| Sunday, January 1, 2017 | 883027000 | 1925713000 |
| Monday, January 1, 2018 | 1020282000 | 2057237000 |
| Tuesday, January 1, 2019 | 997021000 | 2189922000 |
| Wednesday, January 1, 2020 | 1162765000 | 2169182000 |
| Friday, January 1, 2021 | 2165412000 | 2497287000 |
| Saturday, January 1, 2022 | 2171130000 | 2875847000 |
| Sunday, January 1, 2023 | 1245476000 | 3277438000 |
| Monday, January 1, 2024 | 10600515000 | 3727885000 |
Infusing magic into the data realm
In the ever-evolving landscape of the logistics and waste management industries, Waste Connections, Inc. and Expeditors International of Washington, Inc. have emerged as formidable players. Over the past decade, Waste Connections has consistently outperformed its counterpart, showcasing a remarkable 248% increase in gross profit from 2014 to 2023. In contrast, Expeditors International experienced a more modest growth of approximately 63% during the same period.
Waste Connections' gross profit surged from around $940 million in 2014 to an impressive $3.28 billion in 2023, reflecting its strategic expansions and operational efficiencies. Meanwhile, Expeditors International saw its gross profit rise from $764 million to $1.25 billion, highlighting its resilience in a competitive market. This comparison underscores the dynamic nature of these industries and the strategic maneuvers that define success.
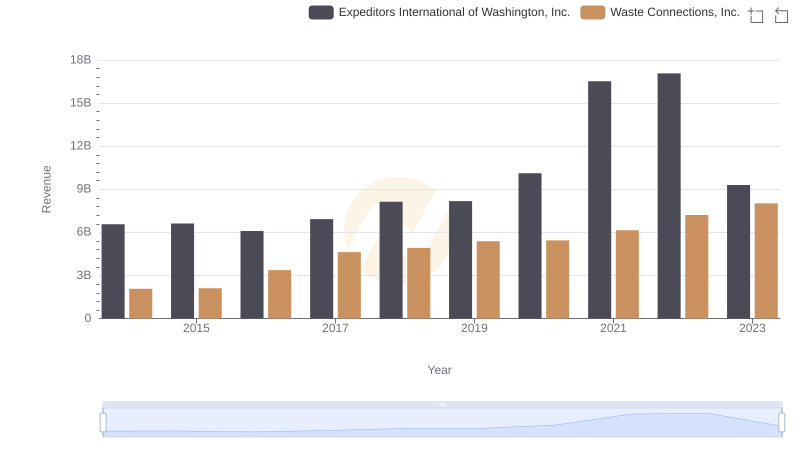
Waste Connections, Inc. or Expeditors International of Washington, Inc.: Who Leads in Yearly Revenue?
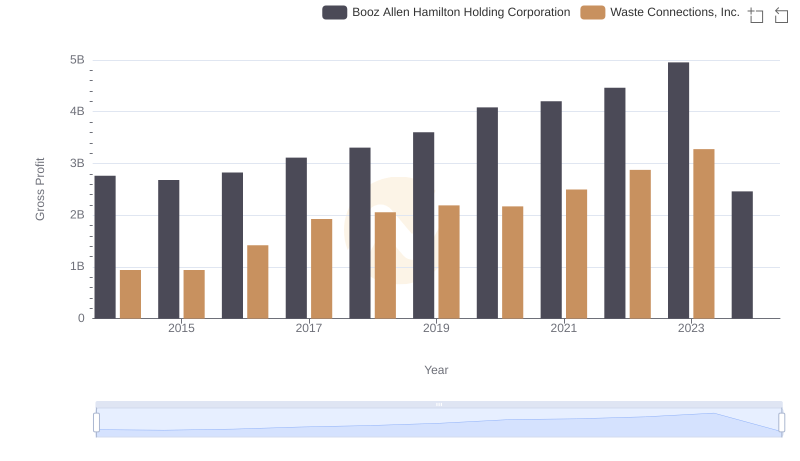
Gross Profit Comparison: Waste Connections, Inc. and Booz Allen Hamilton Holding Corporation Trends

Analyzing Cost of Revenue: Waste Connections, Inc. and Expeditors International of Washington, Inc.
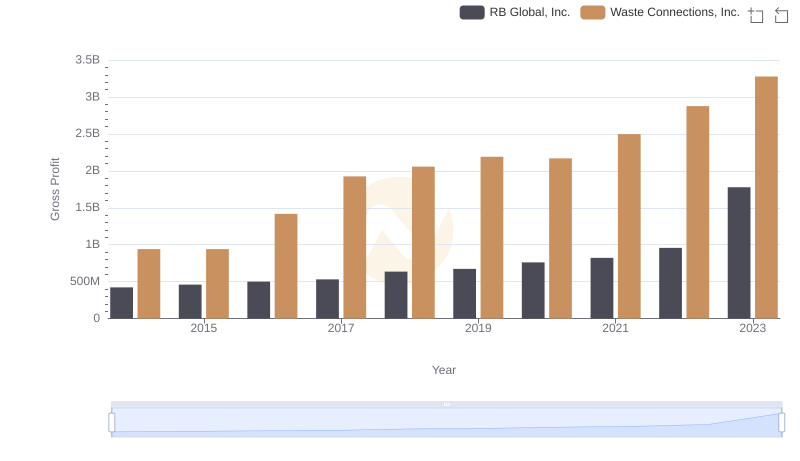
Waste Connections, Inc. and RB Global, Inc.: A Detailed Gross Profit Analysis
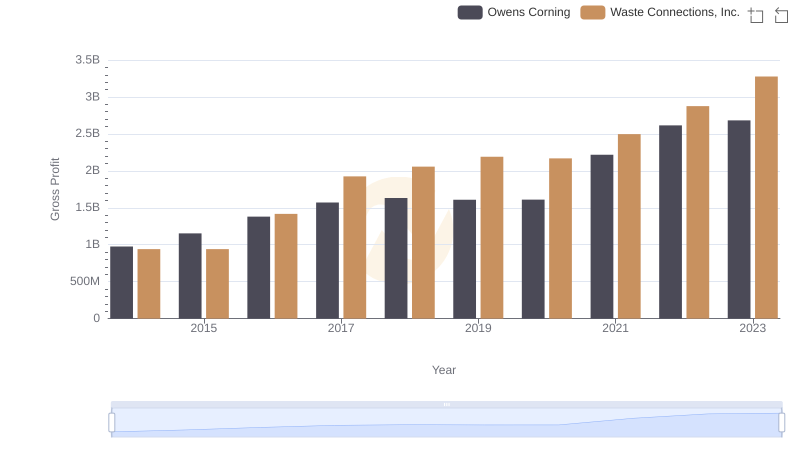
Who Generates Higher Gross Profit? Waste Connections, Inc. or Owens Corning
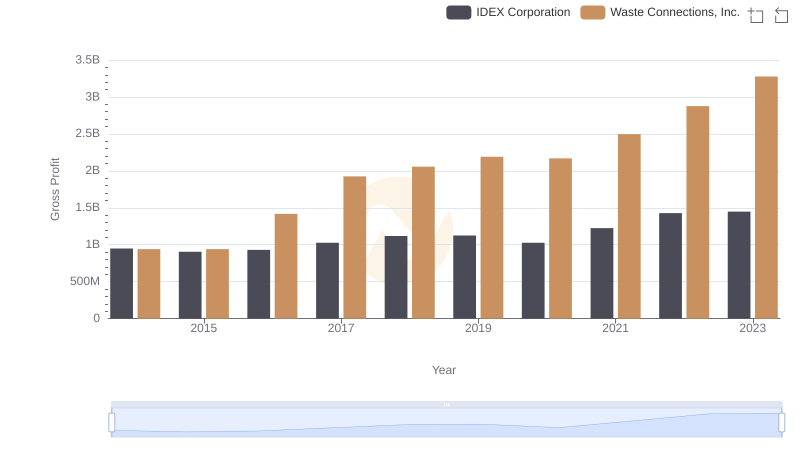
Gross Profit Comparison: Waste Connections, Inc. and IDEX Corporation Trends
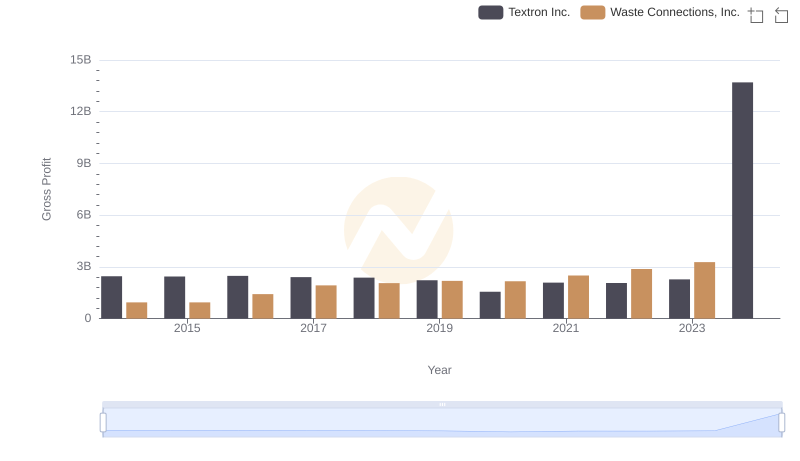
Gross Profit Comparison: Waste Connections, Inc. and Textron Inc. Trends
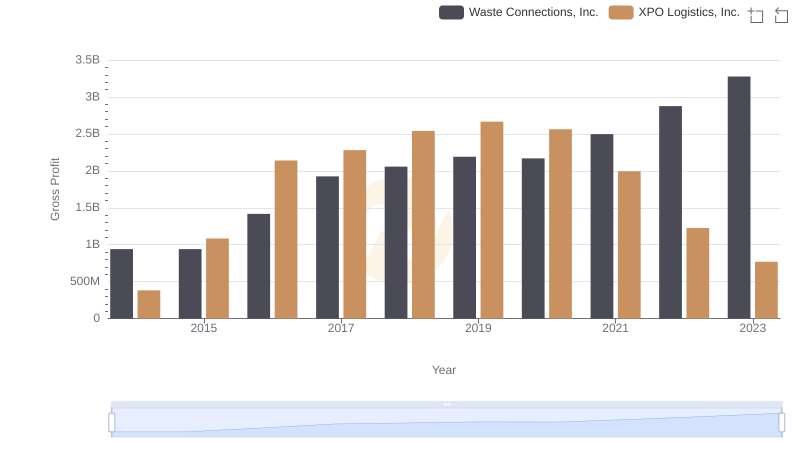
Who Generates Higher Gross Profit? Waste Connections, Inc. or XPO Logistics, Inc.
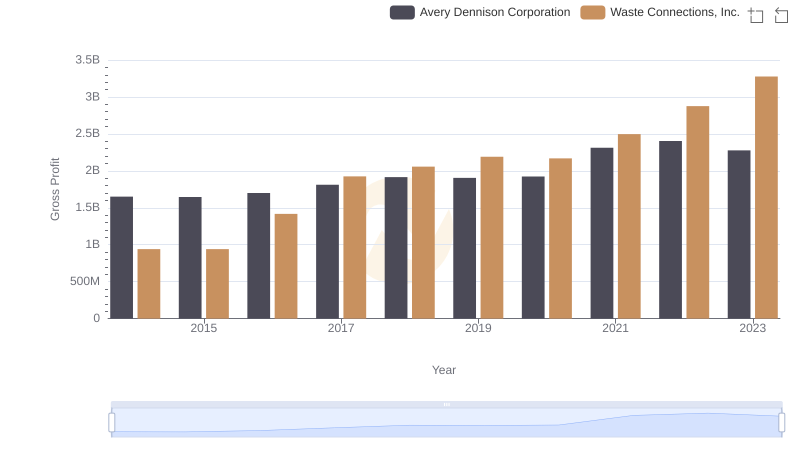
Gross Profit Comparison: Waste Connections, Inc. and Avery Dennison Corporation Trends
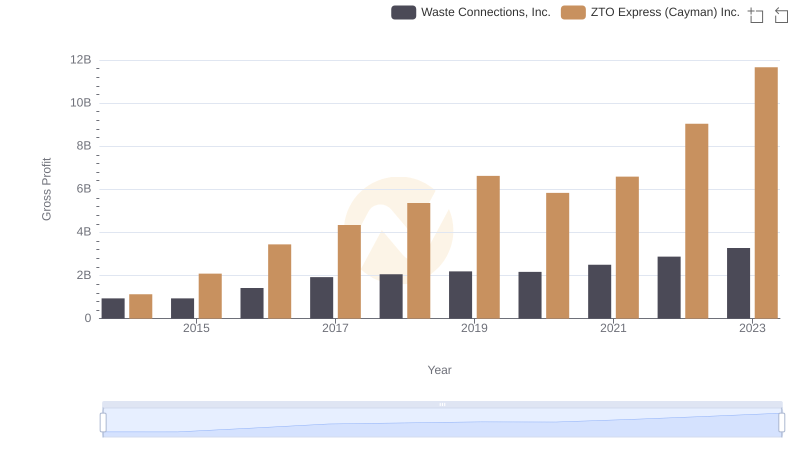
Waste Connections, Inc. vs ZTO Express (Cayman) Inc.: A Gross Profit Performance Breakdown
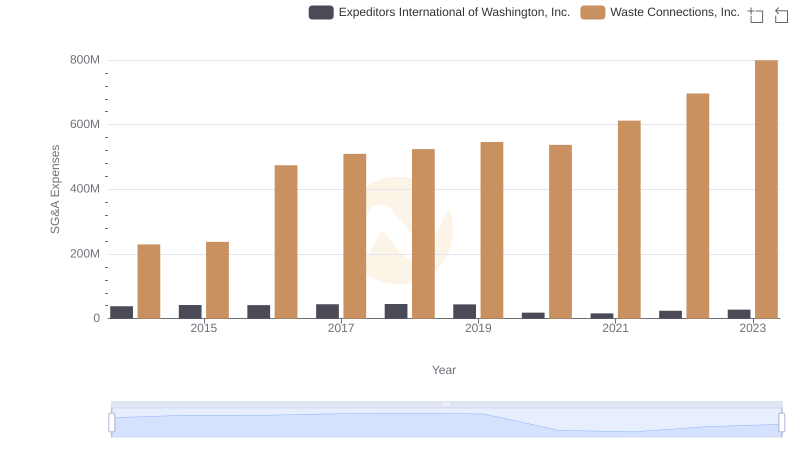
Breaking Down SG&A Expenses: Waste Connections, Inc. vs Expeditors International of Washington, Inc.
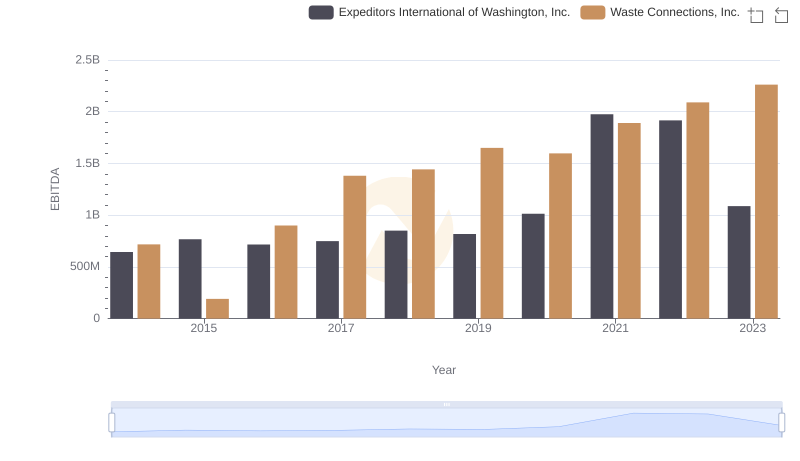
A Side-by-Side Analysis of EBITDA: Waste Connections, Inc. and Expeditors International of Washington, Inc.