| __timestamp | CNH Industrial N.V. | Waste Connections, Inc. |
|---|---|---|
| Wednesday, January 1, 2014 | 32555000000 | 2079166000 |
| Thursday, January 1, 2015 | 25912000000 | 2117287000 |
| Friday, January 1, 2016 | 24872000000 | 3375863000 |
| Sunday, January 1, 2017 | 27361000000 | 4630488000 |
| Monday, January 1, 2018 | 29706000000 | 4922941000 |
| Tuesday, January 1, 2019 | 28079000000 | 5388679000 |
| Wednesday, January 1, 2020 | 26032000000 | 5445990000 |
| Friday, January 1, 2021 | 33428000000 | 6151361000 |
| Saturday, January 1, 2022 | 23551000000 | 7211859000 |
| Sunday, January 1, 2023 | 24694000000 | 8021951000 |
| Monday, January 1, 2024 | 8919591000 |
Igniting the spark of knowledge
In the ever-evolving landscape of industrial giants, Waste Connections, Inc. and CNH Industrial N.V. have carved out significant niches. Over the past decade, these companies have demonstrated contrasting revenue trajectories. Waste Connections, Inc. has seen a remarkable growth, with its revenue surging by nearly 286% from 2014 to 2023. In contrast, CNH Industrial N.V. experienced a more volatile journey, with a peak in 2021 followed by a dip in 2022, resulting in a 24% decrease from its 2014 revenue.
This revenue analysis highlights the resilience and adaptability of Waste Connections, Inc. in the waste management sector, while CNH Industrial N.V. navigates the complexities of the industrial machinery market. As we look to the future, these trends offer valuable insights into the strategic directions and market dynamics shaping these industry leaders.
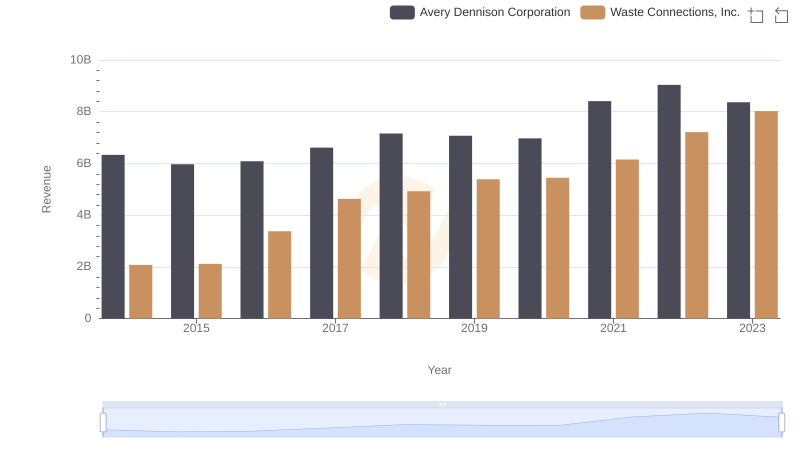
Waste Connections, Inc. vs Avery Dennison Corporation: Annual Revenue Growth Compared
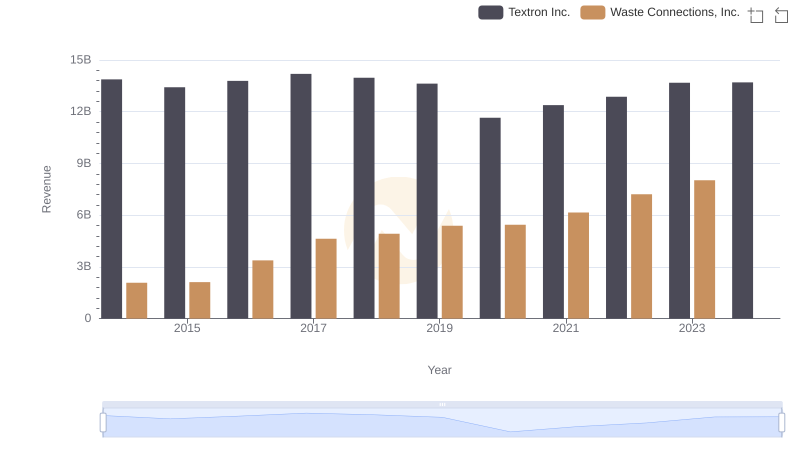
Waste Connections, Inc. and Textron Inc.: A Comprehensive Revenue Analysis
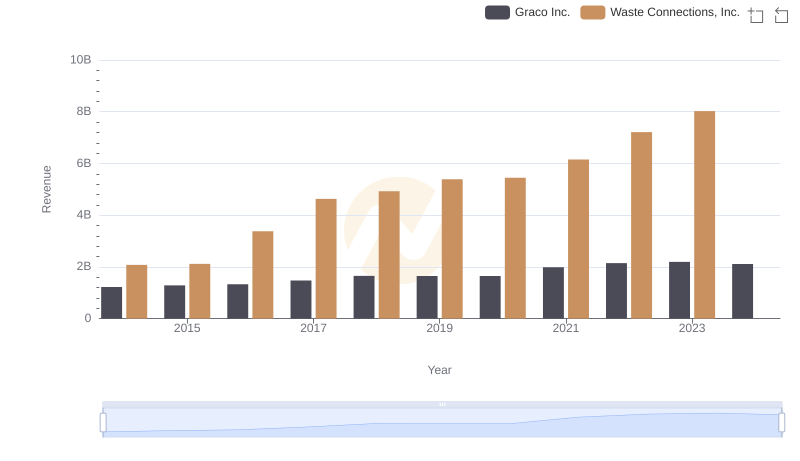
Annual Revenue Comparison: Waste Connections, Inc. vs Graco Inc.
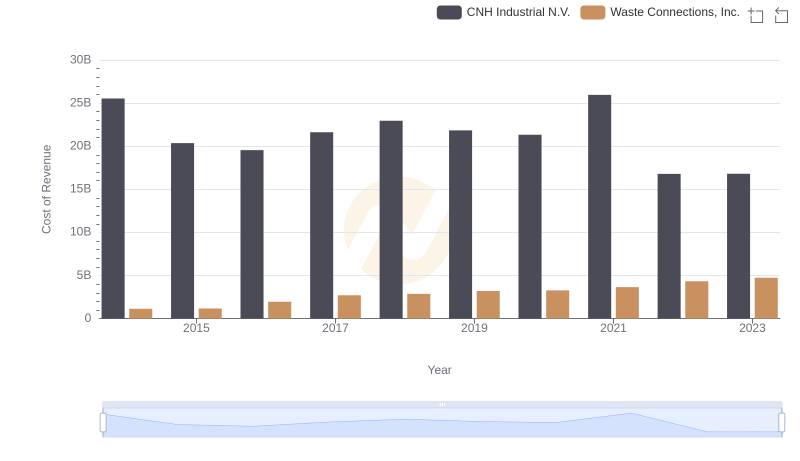
Cost Insights: Breaking Down Waste Connections, Inc. and CNH Industrial N.V.'s Expenses
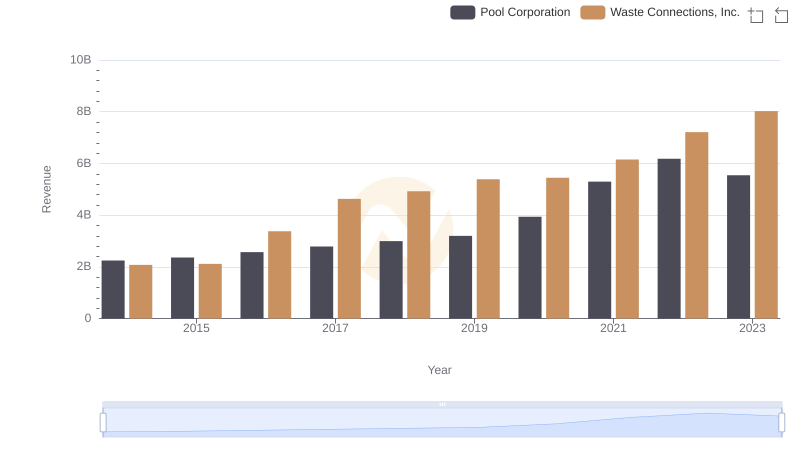
Breaking Down Revenue Trends: Waste Connections, Inc. vs Pool Corporation
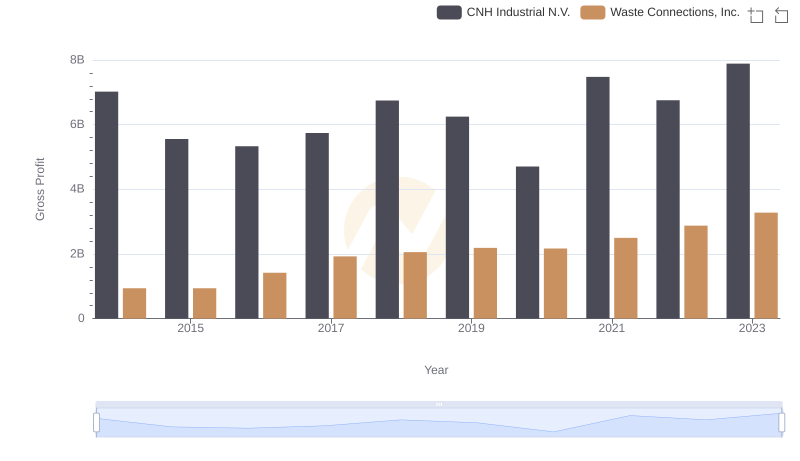
Who Generates Higher Gross Profit? Waste Connections, Inc. or CNH Industrial N.V.
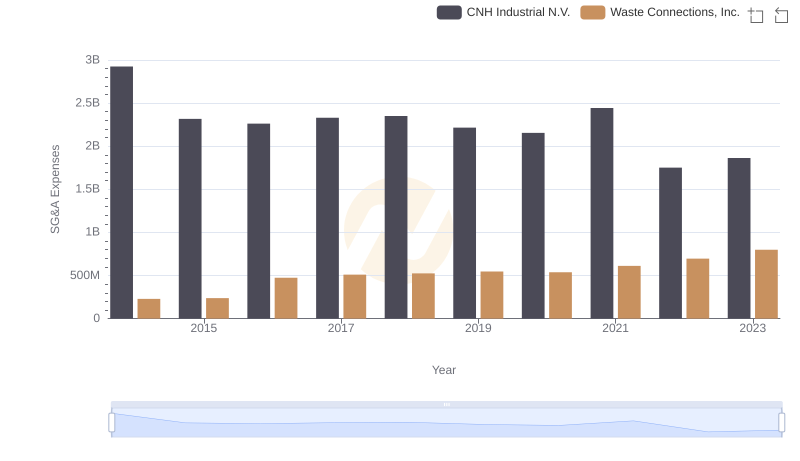
Waste Connections, Inc. vs CNH Industrial N.V.: SG&A Expense Trends
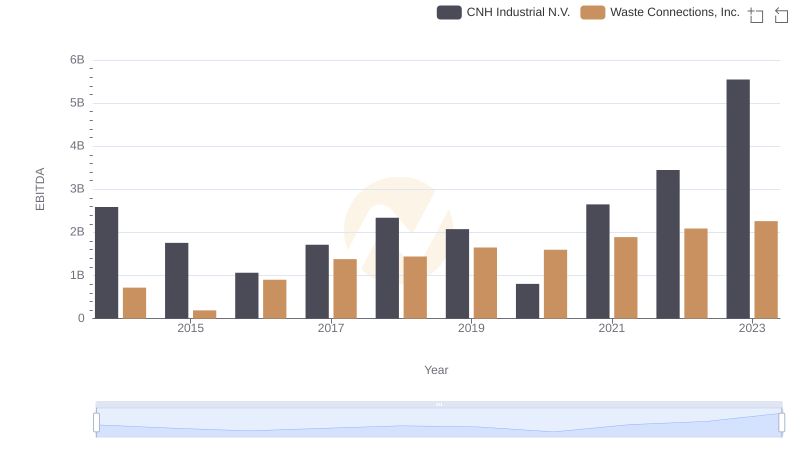
EBITDA Metrics Evaluated: Waste Connections, Inc. vs CNH Industrial N.V.