| __timestamp | CNH Industrial N.V. | Waste Connections, Inc. |
|---|---|---|
| Wednesday, January 1, 2014 | 25534000000 | 1138388000 |
| Thursday, January 1, 2015 | 20357000000 | 1177409000 |
| Friday, January 1, 2016 | 19539000000 | 1957712000 |
| Sunday, January 1, 2017 | 21621000000 | 2704775000 |
| Monday, January 1, 2018 | 22958000000 | 2865704000 |
| Tuesday, January 1, 2019 | 21832000000 | 3198757000 |
| Wednesday, January 1, 2020 | 21327000000 | 3276808000 |
| Friday, January 1, 2021 | 25951000000 | 3654074000 |
| Saturday, January 1, 2022 | 16797000000 | 4336012000 |
| Sunday, January 1, 2023 | 16805000000 | 4744513000 |
| Monday, January 1, 2024 | 5191706000 |
Infusing magic into the data realm
In the ever-evolving landscape of industrial operations, understanding cost structures is pivotal. Waste Connections, Inc. and CNH Industrial N.V. offer a fascinating study in contrasts over the past decade. From 2014 to 2023, CNH Industrial N.V. experienced a notable 34% decline in its cost of revenue, dropping from approximately $25.5 billion to $16.8 billion. This reduction reflects strategic cost management and operational efficiencies.
Conversely, Waste Connections, Inc. saw a remarkable 316% increase in its cost of revenue, rising from $1.1 billion to $4.7 billion. This surge underscores the company's expansion and scaling efforts. The year 2021 marked a peak for CNH Industrial N.V., with costs reaching $25.9 billion, while Waste Connections, Inc. steadily climbed, reflecting its growth trajectory. These insights reveal the dynamic nature of cost management in the industrial sector, highlighting the diverse strategies employed by these two giants.
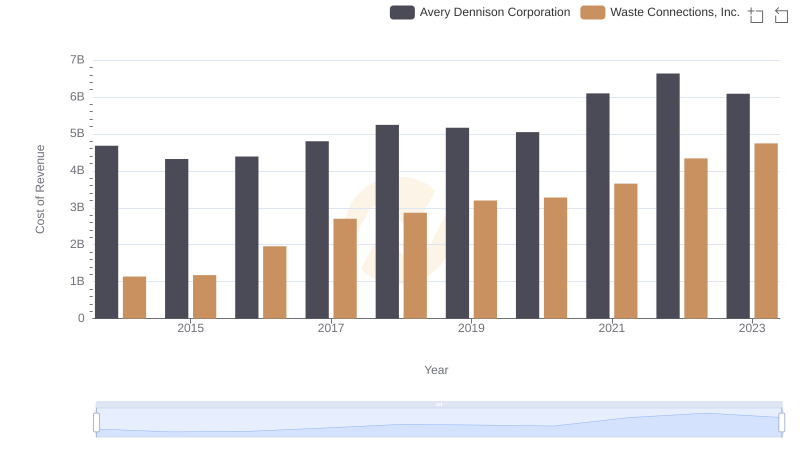
Cost Insights: Breaking Down Waste Connections, Inc. and Avery Dennison Corporation's Expenses
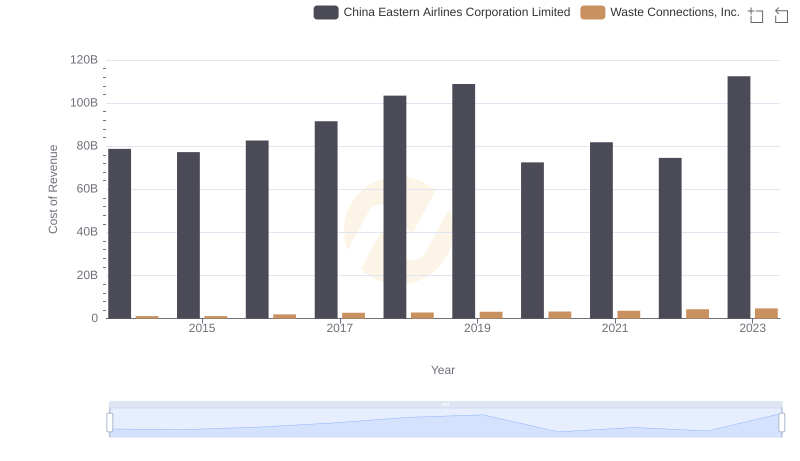
Comparing Cost of Revenue Efficiency: Waste Connections, Inc. vs China Eastern Airlines Corporation Limited
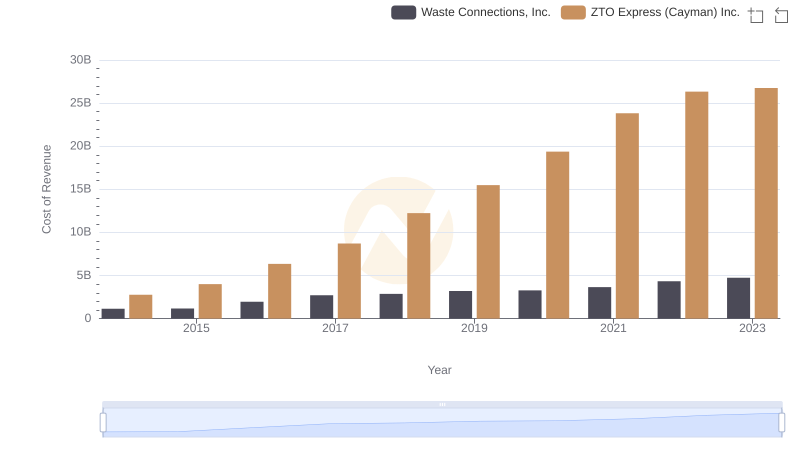
Cost Insights: Breaking Down Waste Connections, Inc. and ZTO Express (Cayman) Inc.'s Expenses
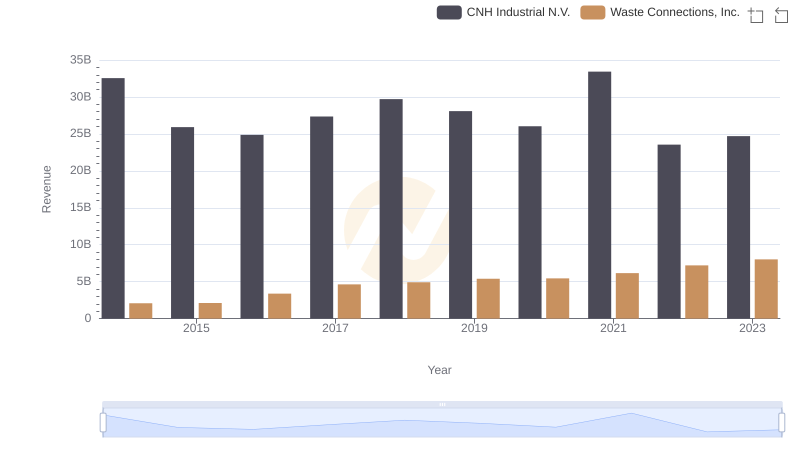
Revenue Showdown: Waste Connections, Inc. vs CNH Industrial N.V.
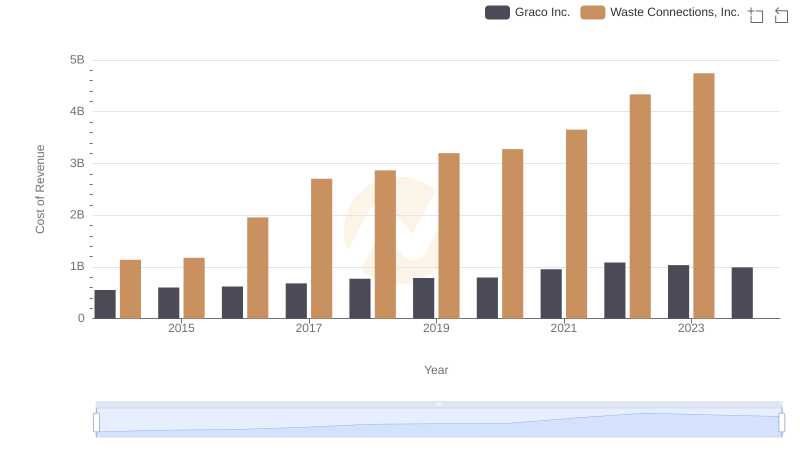
Cost of Revenue: Key Insights for Waste Connections, Inc. and Graco Inc.
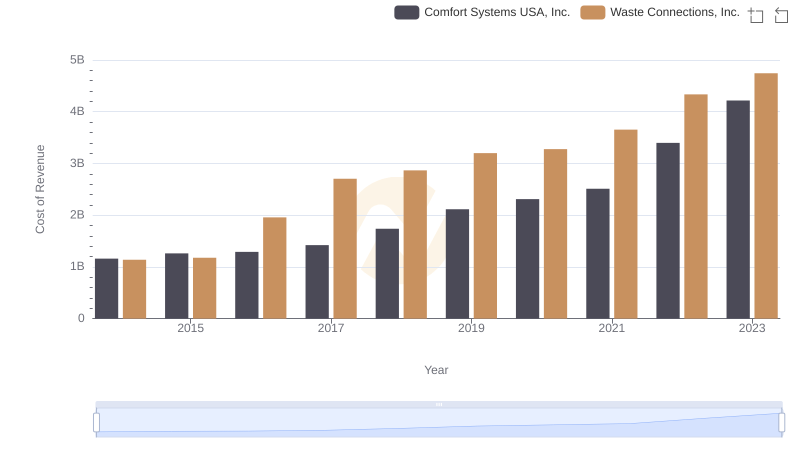
Cost of Revenue Comparison: Waste Connections, Inc. vs Comfort Systems USA, Inc.
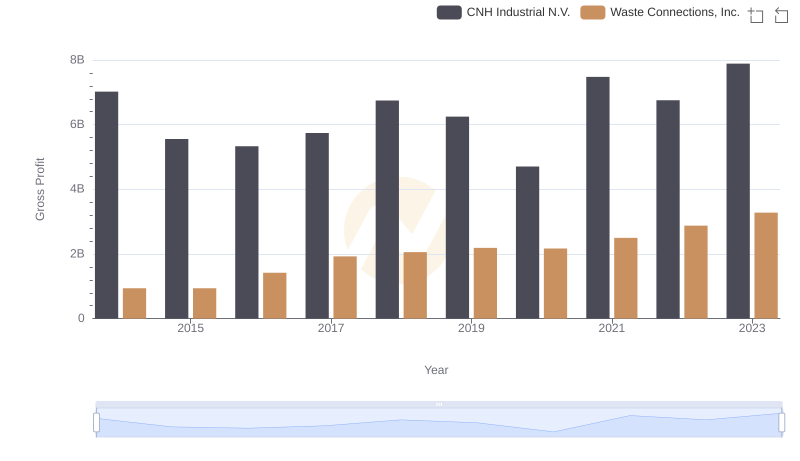
Who Generates Higher Gross Profit? Waste Connections, Inc. or CNH Industrial N.V.
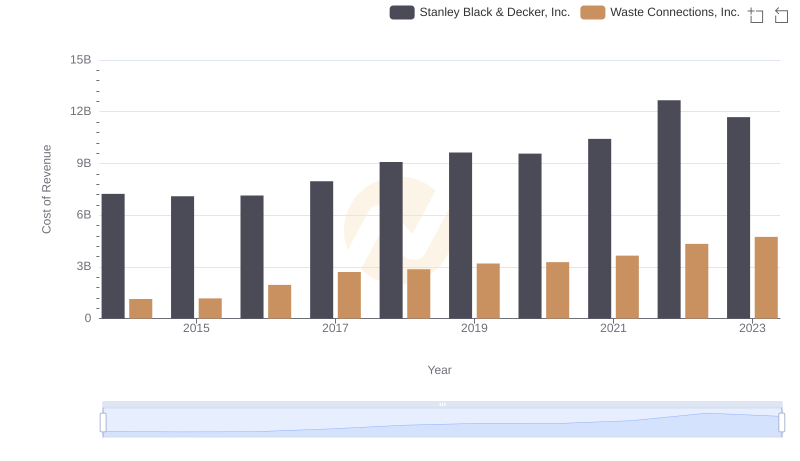
Cost Insights: Breaking Down Waste Connections, Inc. and Stanley Black & Decker, Inc.'s Expenses
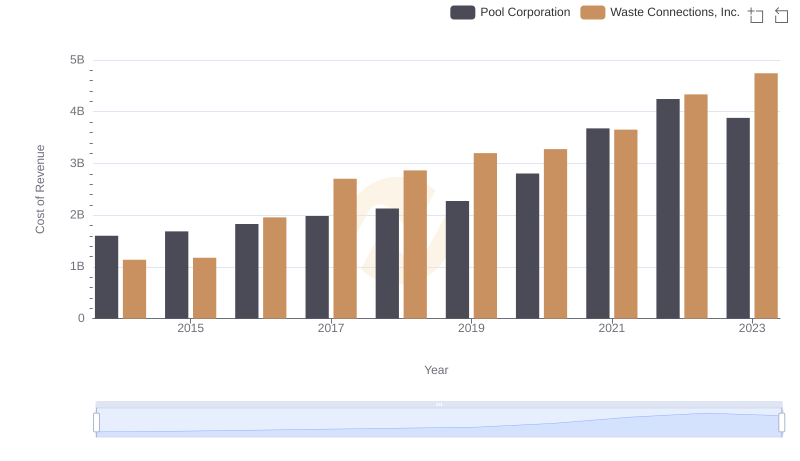
Waste Connections, Inc. vs Pool Corporation: Efficiency in Cost of Revenue Explored
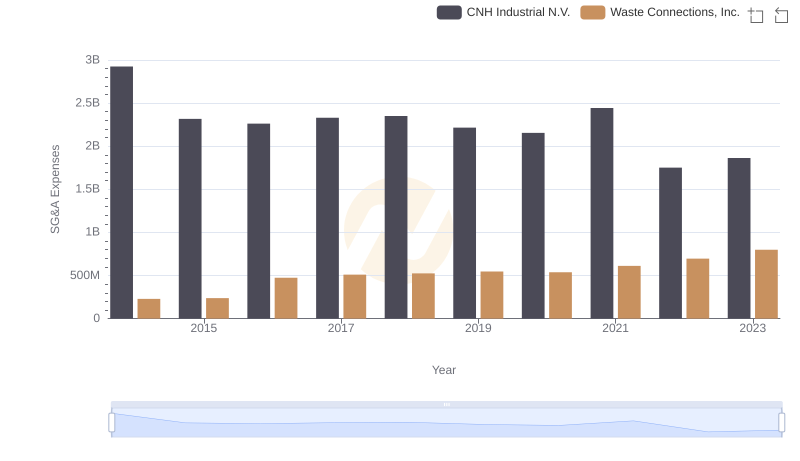
Waste Connections, Inc. vs CNH Industrial N.V.: SG&A Expense Trends
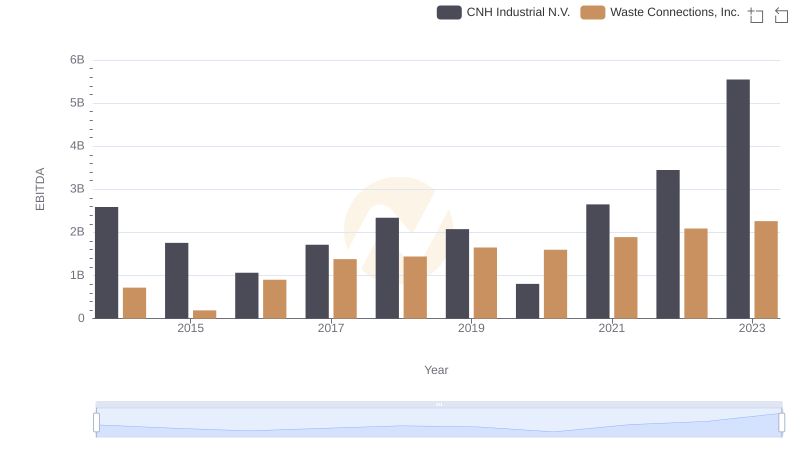
EBITDA Metrics Evaluated: Waste Connections, Inc. vs CNH Industrial N.V.