| __timestamp | Pool Corporation | Waste Connections, Inc. |
|---|---|---|
| Wednesday, January 1, 2014 | 643340000 | 940778000 |
| Thursday, January 1, 2015 | 675644000 | 939878000 |
| Friday, January 1, 2016 | 741087000 | 1418151000 |
| Sunday, January 1, 2017 | 805289000 | 1925713000 |
| Monday, January 1, 2018 | 870173000 | 2057237000 |
| Tuesday, January 1, 2019 | 924925000 | 2189922000 |
| Wednesday, January 1, 2020 | 1130902000 | 2169182000 |
| Friday, January 1, 2021 | 1617092000 | 2497287000 |
| Saturday, January 1, 2022 | 1933412000 | 2875847000 |
| Sunday, January 1, 2023 | 1660044000 | 3277438000 |
| Monday, January 1, 2024 | 3727885000 |
Igniting the spark of knowledge
In the ever-evolving landscape of the waste management and pool supply industries, Waste Connections, Inc. and Pool Corporation have demonstrated remarkable growth over the past decade. From 2014 to 2023, Waste Connections, Inc. has seen its gross profit soar by approximately 248%, reaching a peak in 2023. This growth underscores the company's strategic expansions and operational efficiencies.
Meanwhile, Pool Corporation, a leader in the pool supply sector, has also experienced significant growth, with its gross profit increasing by around 158% over the same period. Despite a slight dip in 2023, Pool Corporation's consistent upward trend highlights its resilience and adaptability in a competitive market.
These insights reveal not only the financial health of these companies but also their ability to navigate industry challenges and capitalize on opportunities, making them key players in their respective fields.
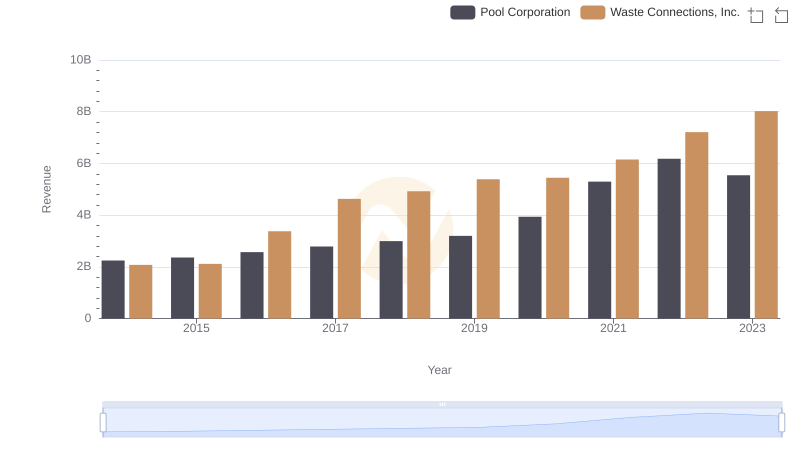
Breaking Down Revenue Trends: Waste Connections, Inc. vs Pool Corporation
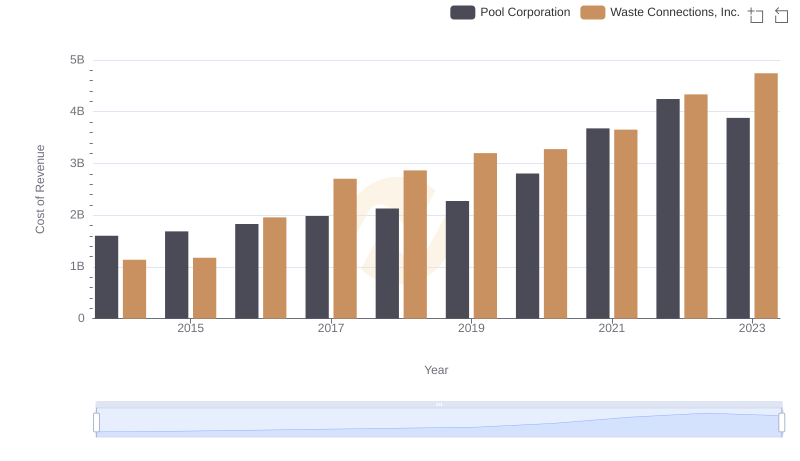
Waste Connections, Inc. vs Pool Corporation: Efficiency in Cost of Revenue Explored
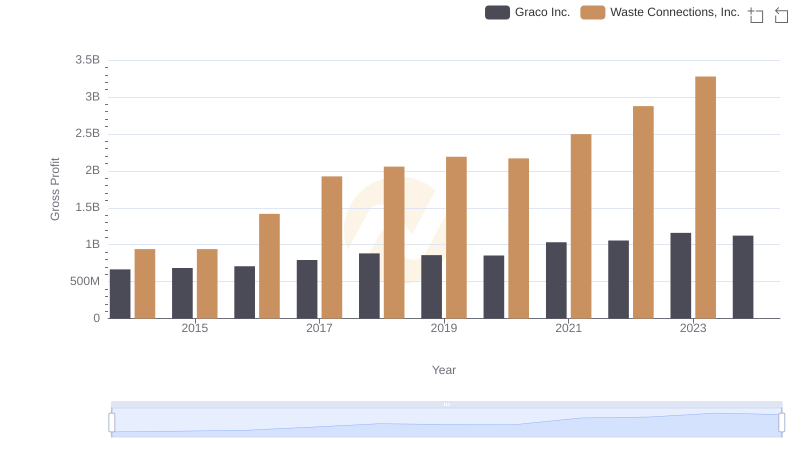
Waste Connections, Inc. vs Graco Inc.: A Gross Profit Performance Breakdown
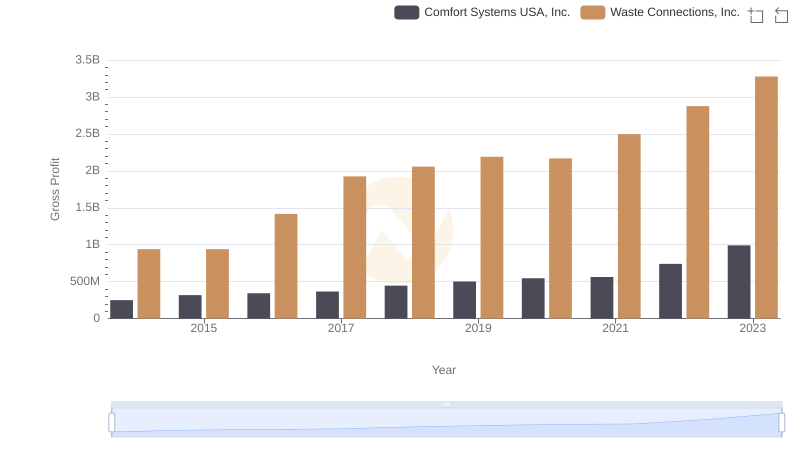
Gross Profit Trends Compared: Waste Connections, Inc. vs Comfort Systems USA, Inc.
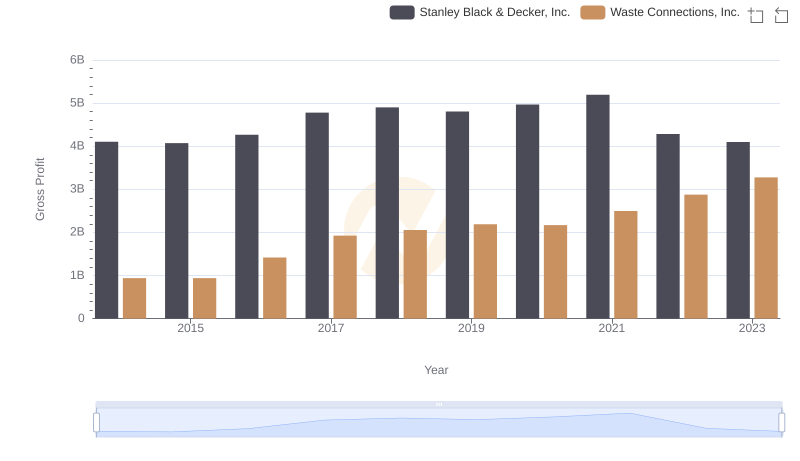
Gross Profit Analysis: Comparing Waste Connections, Inc. and Stanley Black & Decker, Inc.

Waste Connections, Inc. and AECOM: A Detailed Gross Profit Analysis
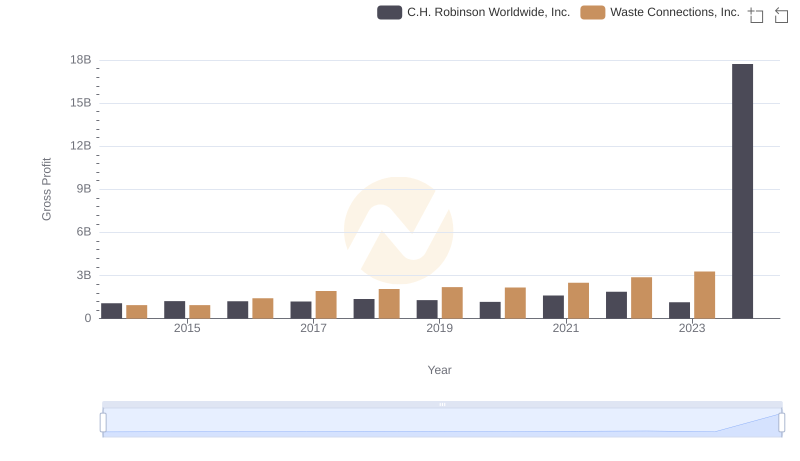
Key Insights on Gross Profit: Waste Connections, Inc. vs C.H. Robinson Worldwide, Inc.
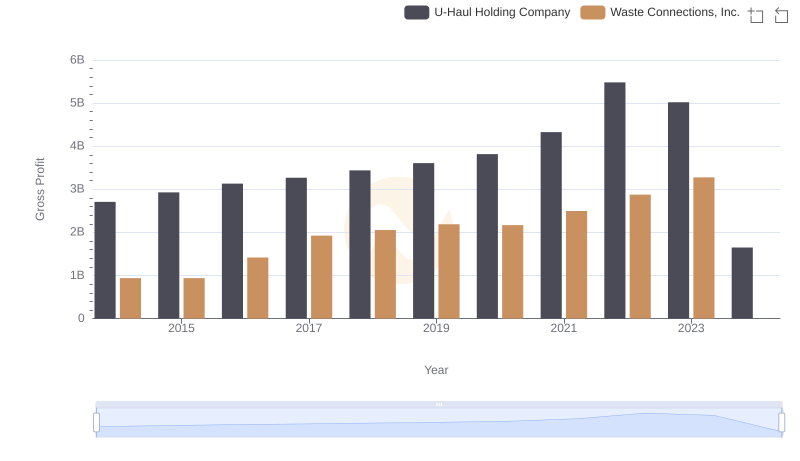
Key Insights on Gross Profit: Waste Connections, Inc. vs U-Haul Holding Company
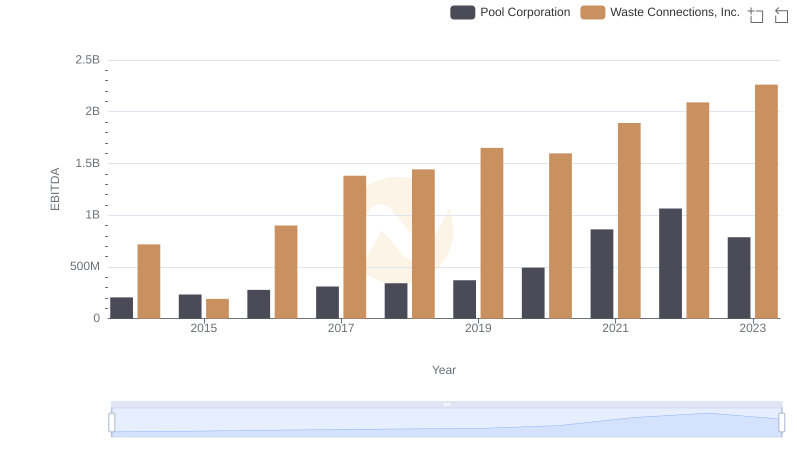
A Professional Review of EBITDA: Waste Connections, Inc. Compared to Pool Corporation