| __timestamp | CNH Industrial N.V. | Waste Connections, Inc. |
|---|---|---|
| Wednesday, January 1, 2014 | 2591000000 | 717805000 |
| Thursday, January 1, 2015 | 1757000000 | 191002871 |
| Friday, January 1, 2016 | 1063000000 | 900371894 |
| Sunday, January 1, 2017 | 1715000000 | 1380632000 |
| Monday, January 1, 2018 | 2339000000 | 1442229014 |
| Tuesday, January 1, 2019 | 2077000000 | 1650754605 |
| Wednesday, January 1, 2020 | 807000000 | 1597555000 |
| Friday, January 1, 2021 | 2650000000 | 1891001000 |
| Saturday, January 1, 2022 | 3447000000 | 2090554149 |
| Sunday, January 1, 2023 | 5549000000 | 2261354000 |
| Monday, January 1, 2024 | 2389779000 |
Igniting the spark of knowledge
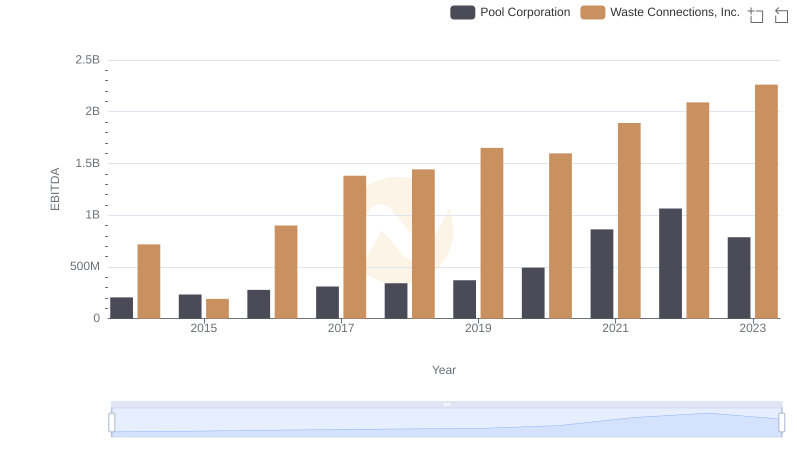
In the ever-evolving landscape of industrial and waste management sectors, two titans have emerged: Waste Connections, Inc. and CNH Industrial N.V. Over the past decade, these companies have showcased remarkable growth in their EBITDA, a key indicator of financial health and operational efficiency.
From 2014 to 2023, CNH Industrial N.V. has seen its EBITDA soar by approximately 114%, peaking in 2023. This growth reflects its strategic expansions and innovations in the industrial sector. Meanwhile, Waste Connections, Inc. has demonstrated a steady upward trajectory, with its EBITDA increasing by around 215% over the same period, highlighting its robust market presence and operational excellence in waste management.
This comparison not only underscores the dynamic nature of these industries but also offers valuable insights into the strategic maneuvers that have propelled these companies to the forefront of their respective fields.
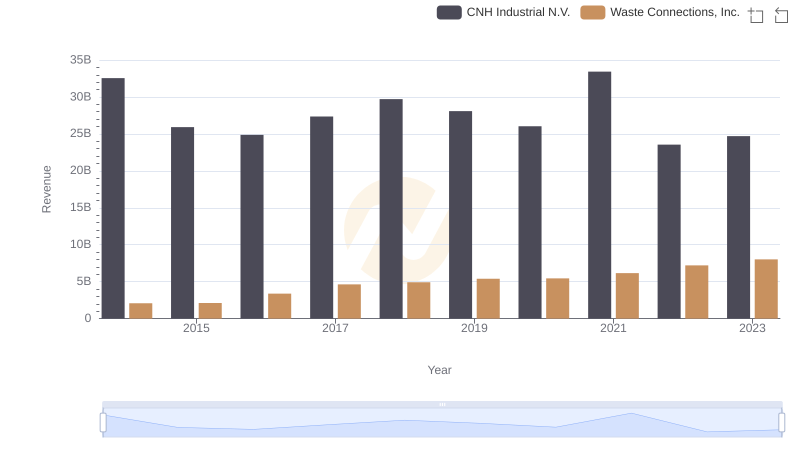
Revenue Showdown: Waste Connections, Inc. vs CNH Industrial N.V.
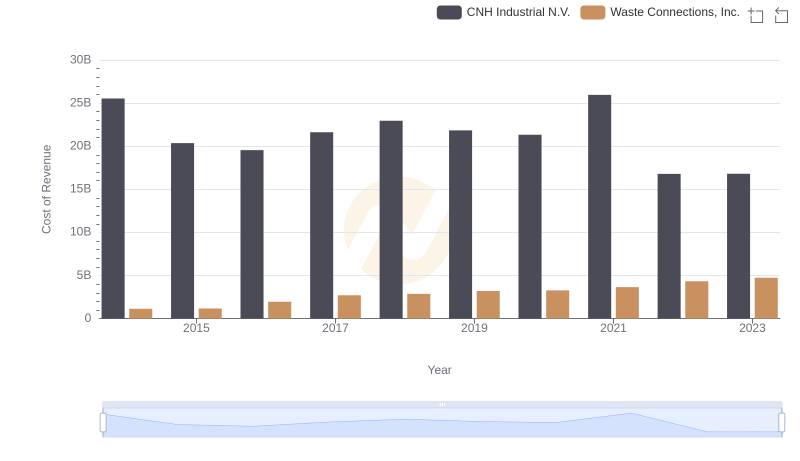
Cost Insights: Breaking Down Waste Connections, Inc. and CNH Industrial N.V.'s Expenses
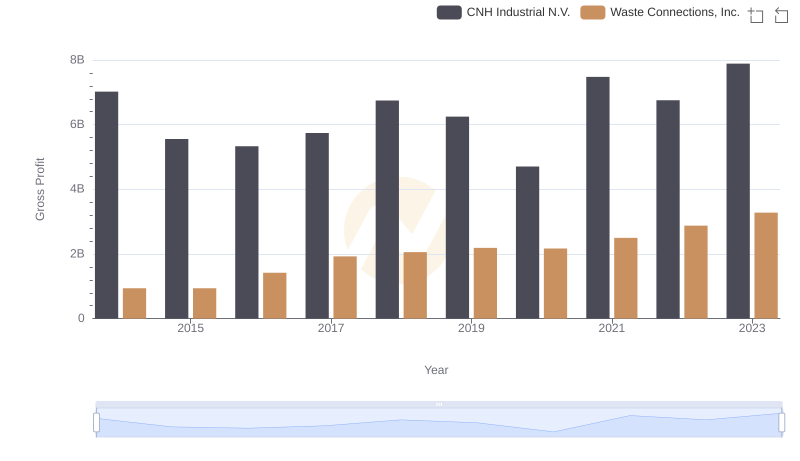
Who Generates Higher Gross Profit? Waste Connections, Inc. or CNH Industrial N.V.
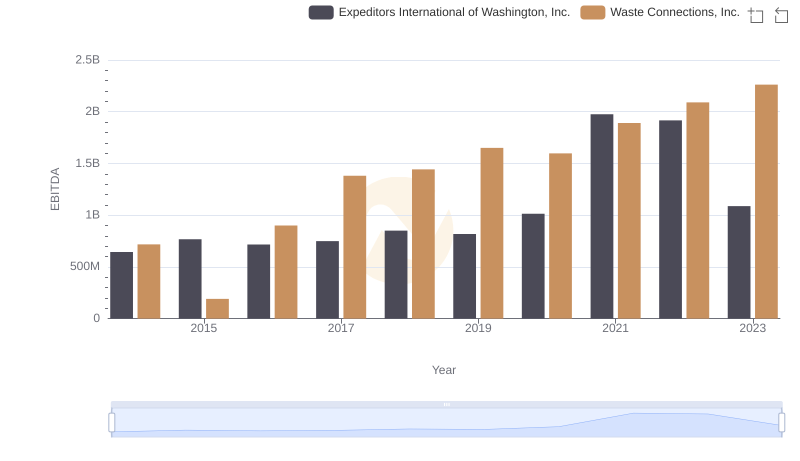
A Side-by-Side Analysis of EBITDA: Waste Connections, Inc. and Expeditors International of Washington, Inc.
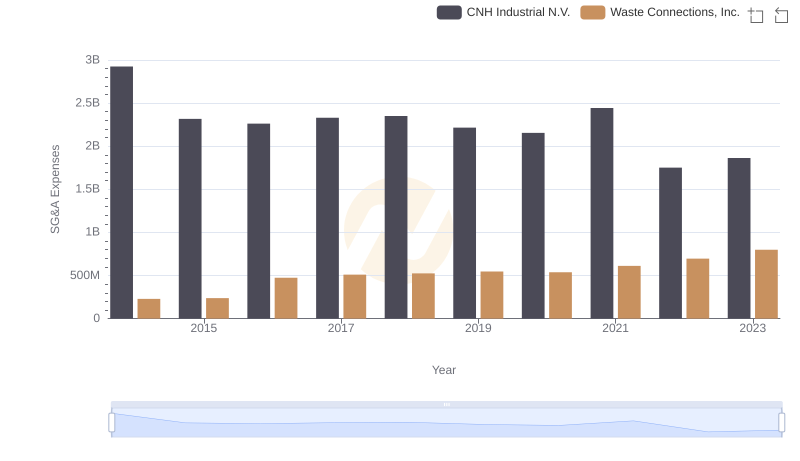
Waste Connections, Inc. vs CNH Industrial N.V.: SG&A Expense Trends

Professional EBITDA Benchmarking: Waste Connections, Inc. vs Graco Inc.
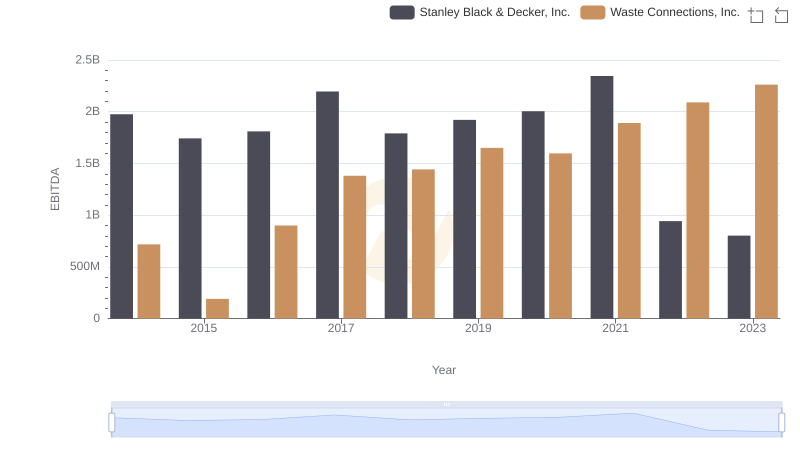
Professional EBITDA Benchmarking: Waste Connections, Inc. vs Stanley Black & Decker, Inc.
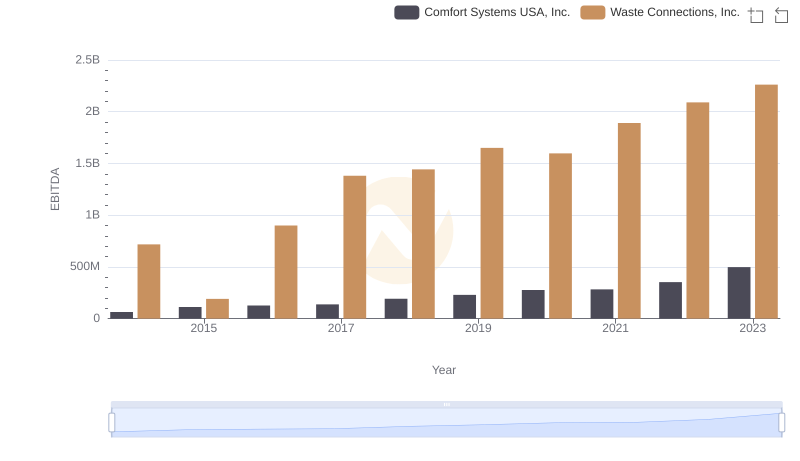
Waste Connections, Inc. vs Comfort Systems USA, Inc.: In-Depth EBITDA Performance Comparison
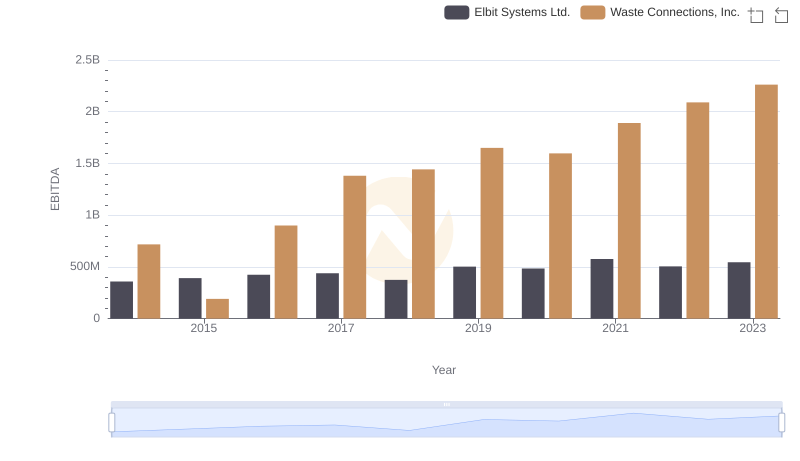
Comprehensive EBITDA Comparison: Waste Connections, Inc. vs Elbit Systems Ltd.
A Professional Review of EBITDA: Waste Connections, Inc. Compared to Pool Corporation