| __timestamp | Stanley Black & Decker, Inc. | Waste Connections, Inc. |
|---|---|---|
| Wednesday, January 1, 2014 | 4102700000 | 940778000 |
| Thursday, January 1, 2015 | 4072000000 | 939878000 |
| Friday, January 1, 2016 | 4267200000 | 1418151000 |
| Sunday, January 1, 2017 | 4778000000 | 1925713000 |
| Monday, January 1, 2018 | 4901900000 | 2057237000 |
| Tuesday, January 1, 2019 | 4805500000 | 2189922000 |
| Wednesday, January 1, 2020 | 4967900000 | 2169182000 |
| Friday, January 1, 2021 | 5194200000 | 2497287000 |
| Saturday, January 1, 2022 | 4284100000 | 2875847000 |
| Sunday, January 1, 2023 | 4098000000 | 3277438000 |
| Monday, January 1, 2024 | 4514400000 | 3727885000 |
Cracking the code
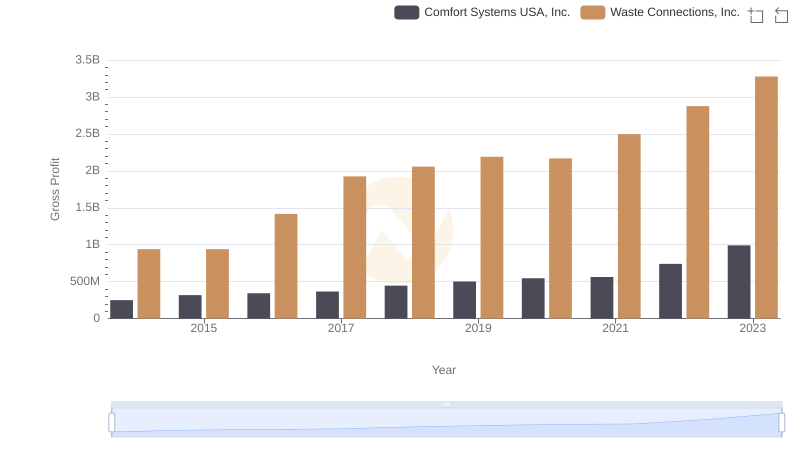
In the ever-evolving landscape of corporate profitability, Waste Connections, Inc. and Stanley Black & Decker, Inc. present a fascinating study in contrasts. Over the past decade, from 2014 to 2023, Stanley Black & Decker has maintained a relatively stable gross profit, peaking in 2021 with a 13% increase from 2014. However, recent years have seen a decline, with 2023 figures dropping by approximately 21% from their peak.
Conversely, Waste Connections has demonstrated a robust growth trajectory, with gross profit surging by nearly 248% over the same period. This remarkable growth underscores the company's strategic prowess in capitalizing on market opportunities. As of 2023, Waste Connections' gross profit has surpassed Stanley Black & Decker's, marking a significant shift in the competitive landscape. This analysis highlights the dynamic nature of business performance and the importance of strategic adaptability.
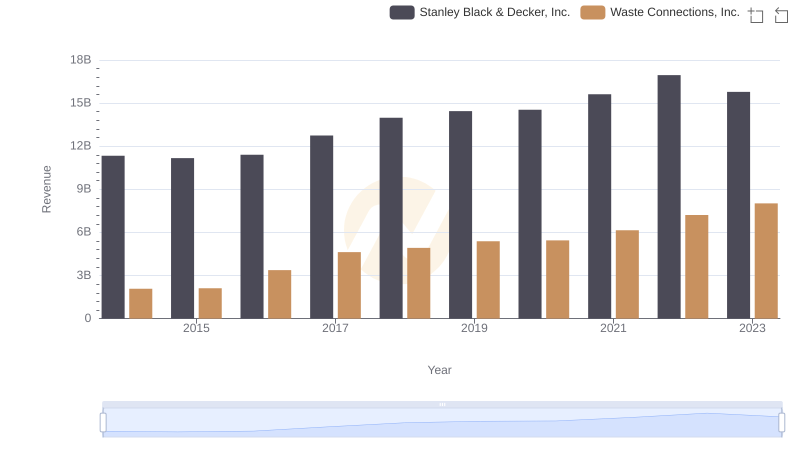
Comparing Revenue Performance: Waste Connections, Inc. or Stanley Black & Decker, Inc.?

Who Generates Higher Gross Profit? Waste Connections, Inc. or Stanley Black & Decker, Inc.
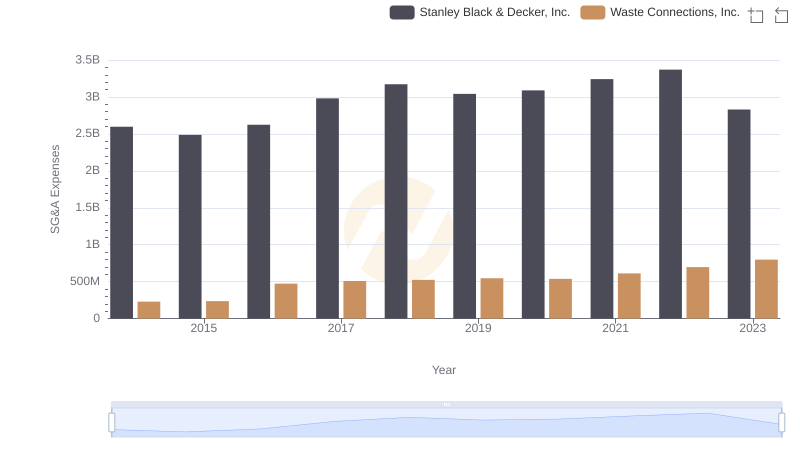
Breaking Down SG&A Expenses: Waste Connections, Inc. vs Stanley Black & Decker, Inc.
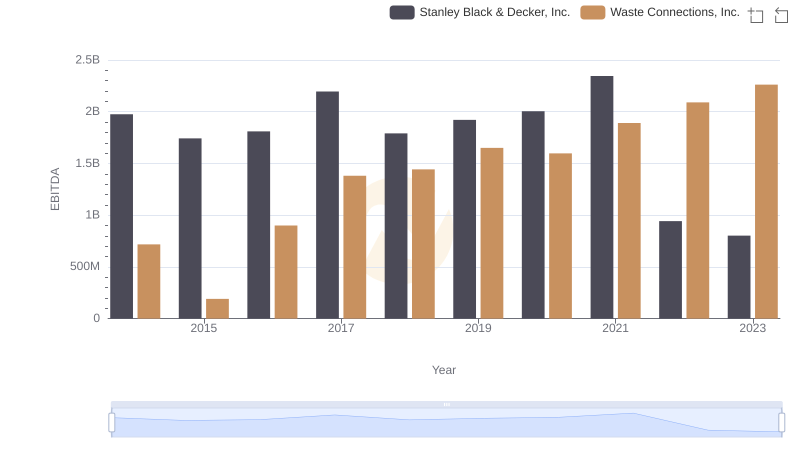
A Professional Review of EBITDA: Waste Connections, Inc. Compared to Stanley Black & Decker, Inc.
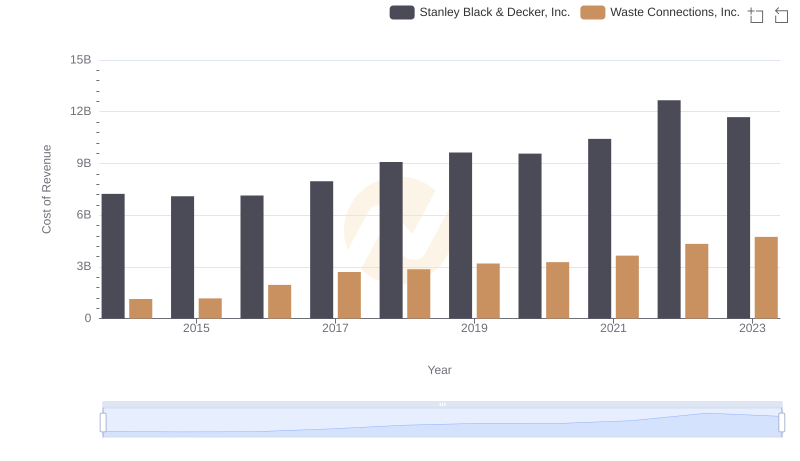
Cost Insights: Breaking Down Waste Connections, Inc. and Stanley Black & Decker, Inc.'s Expenses
Gross Profit Trends Compared: Waste Connections, Inc. vs Comfort Systems USA, Inc.

Key Insights on Gross Profit: Waste Connections, Inc. vs Pool Corporation

Waste Connections, Inc. and AECOM: A Detailed Gross Profit Analysis

Professional EBITDA Benchmarking: Waste Connections, Inc. vs Stanley Black & Decker, Inc.