| __timestamp | Graco Inc. | Waste Connections, Inc. |
|---|---|---|
| Wednesday, January 1, 2014 | 666736000 | 940778000 |
| Thursday, January 1, 2015 | 684700000 | 939878000 |
| Friday, January 1, 2016 | 708239000 | 1418151000 |
| Sunday, January 1, 2017 | 793049000 | 1925713000 |
| Monday, January 1, 2018 | 882539000 | 2057237000 |
| Tuesday, January 1, 2019 | 859756000 | 2189922000 |
| Wednesday, January 1, 2020 | 854937000 | 2169182000 |
| Friday, January 1, 2021 | 1033949000 | 2497287000 |
| Saturday, January 1, 2022 | 1057439000 | 2875847000 |
| Sunday, January 1, 2023 | 1161021000 | 3277438000 |
| Monday, January 1, 2024 | 1122461000 | 3727885000 |
Infusing magic into the data realm
In the competitive landscape of industrial and waste management sectors, Waste Connections, Inc. and Graco Inc. have shown remarkable growth in their gross profits over the past decade. Waste Connections, Inc. has consistently outperformed Graco Inc., with a staggering 248% increase in gross profit from 2014 to 2023. In 2014, Waste Connections, Inc. started with a gross profit of approximately $940 million, which soared to over $3.27 billion by 2023. Meanwhile, Graco Inc. experienced a steady growth of about 74%, starting from $667 million in 2014 and reaching $1.16 billion in 2023. This data highlights the robust expansion of Waste Connections, Inc. in the waste management industry, while Graco Inc. maintains a steady pace in the industrial sector. The year 2024 data for Waste Connections, Inc. is missing, leaving room for speculation on its future trajectory.
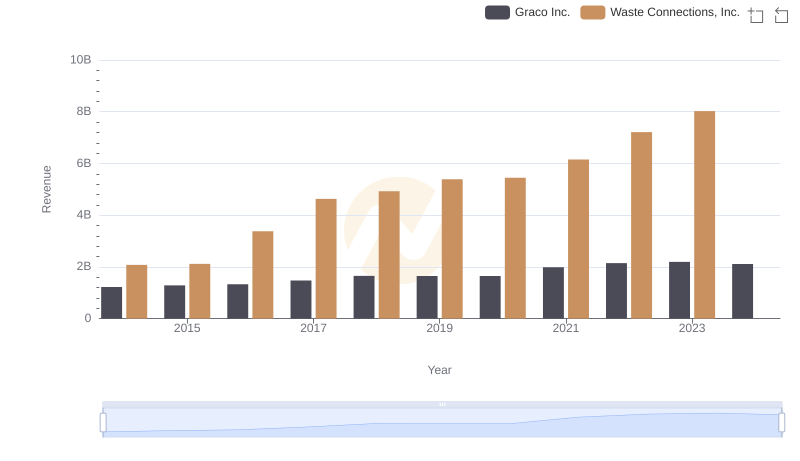
Annual Revenue Comparison: Waste Connections, Inc. vs Graco Inc.
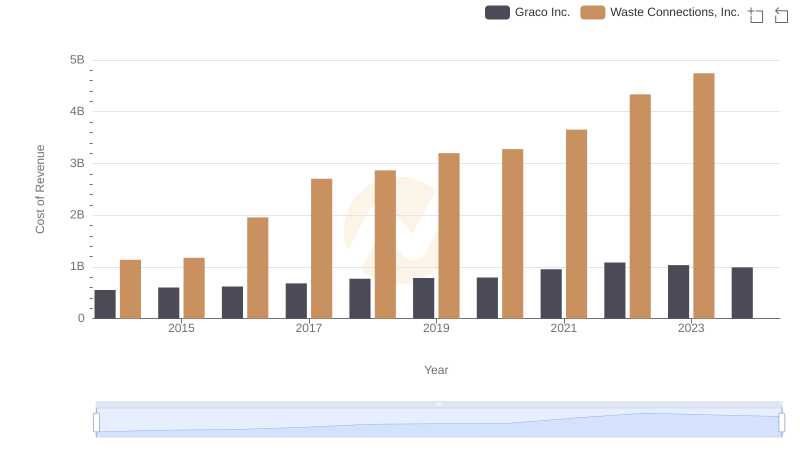
Cost of Revenue: Key Insights for Waste Connections, Inc. and Graco Inc.
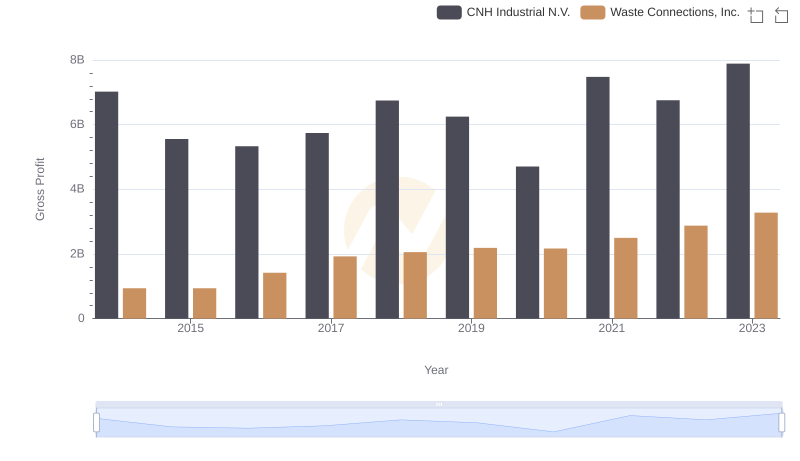
Who Generates Higher Gross Profit? Waste Connections, Inc. or CNH Industrial N.V.
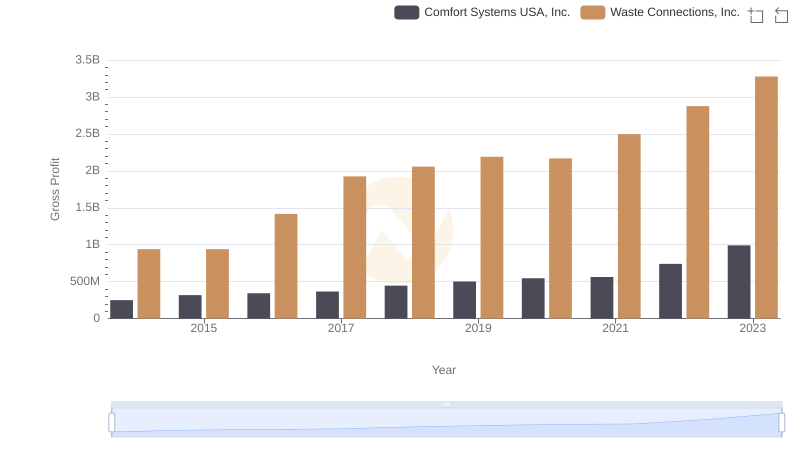
Gross Profit Trends Compared: Waste Connections, Inc. vs Comfort Systems USA, Inc.
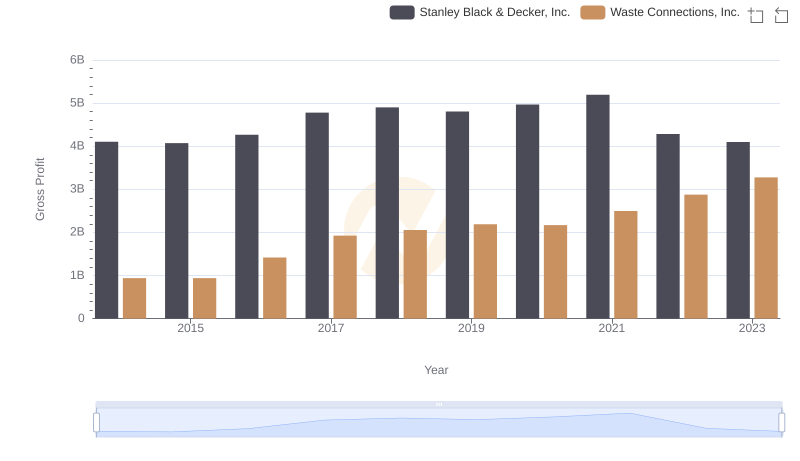
Gross Profit Analysis: Comparing Waste Connections, Inc. and Stanley Black & Decker, Inc.
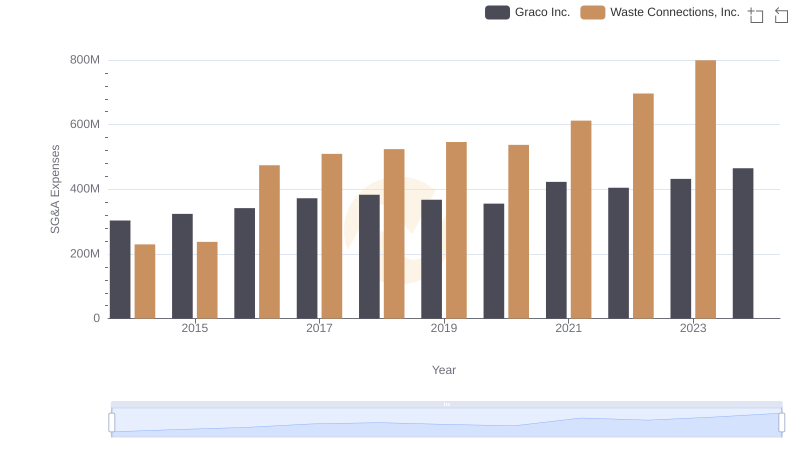
Operational Costs Compared: SG&A Analysis of Waste Connections, Inc. and Graco Inc.

Key Insights on Gross Profit: Waste Connections, Inc. vs Pool Corporation

Waste Connections, Inc. and AECOM: A Detailed Gross Profit Analysis
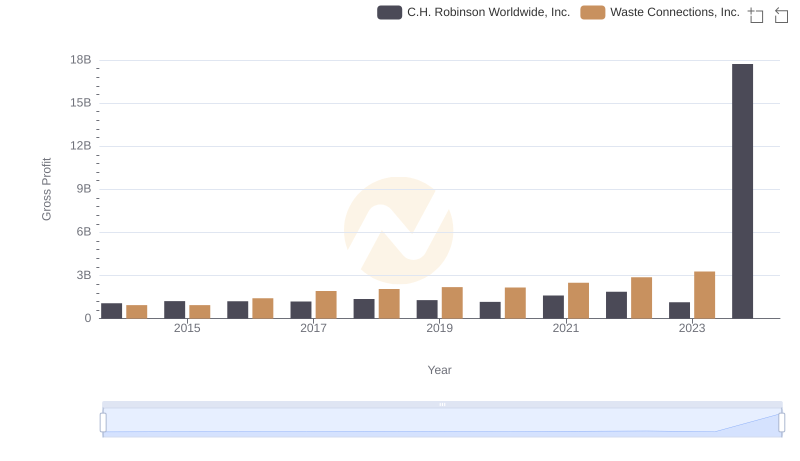
Key Insights on Gross Profit: Waste Connections, Inc. vs C.H. Robinson Worldwide, Inc.

Professional EBITDA Benchmarking: Waste Connections, Inc. vs Graco Inc.