| __timestamp | Pool Corporation | Westinghouse Air Brake Technologies Corporation |
|---|---|---|
| Wednesday, January 1, 2014 | 454470000 | 324539000 |
| Thursday, January 1, 2015 | 459422000 | 319173000 |
| Friday, January 1, 2016 | 485228000 | 327505000 |
| Sunday, January 1, 2017 | 520918000 | 482852000 |
| Monday, January 1, 2018 | 556284000 | 573644000 |
| Tuesday, January 1, 2019 | 583679000 | 936600000 |
| Wednesday, January 1, 2020 | 659931000 | 877100000 |
| Friday, January 1, 2021 | 786808000 | 1005000000 |
| Saturday, January 1, 2022 | 907629000 | 1020000000 |
| Sunday, January 1, 2023 | 912927000 | 1139000000 |
| Monday, January 1, 2024 | 1248000000 |
Unveiling the hidden dimensions of data
In the ever-evolving landscape of corporate finance, understanding the trends in Selling, General, and Administrative (SG&A) expenses is crucial for investors and analysts alike. This analysis delves into the SG&A expense patterns of two industry giants: Westinghouse Air Brake Technologies Corporation and Pool Corporation, from 2014 to 2023.
Over the past decade, Westinghouse Air Brake Technologies Corporation has seen a significant increase in SG&A expenses, rising by approximately 250% from 2014 to 2023. In contrast, Pool Corporation's SG&A expenses have grown by about 100% during the same period. Notably, Westinghouse's expenses surpassed Pool's in 2019, maintaining a lead through 2023. This trend highlights Westinghouse's aggressive expansion and operational strategies.
These insights provide a window into the strategic priorities of these corporations, offering valuable information for stakeholders aiming to make informed decisions.
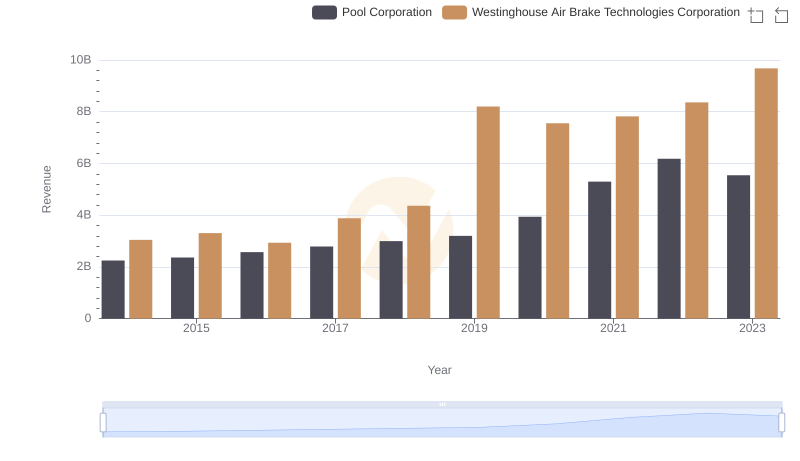
Westinghouse Air Brake Technologies Corporation and Pool Corporation: A Comprehensive Revenue Analysis
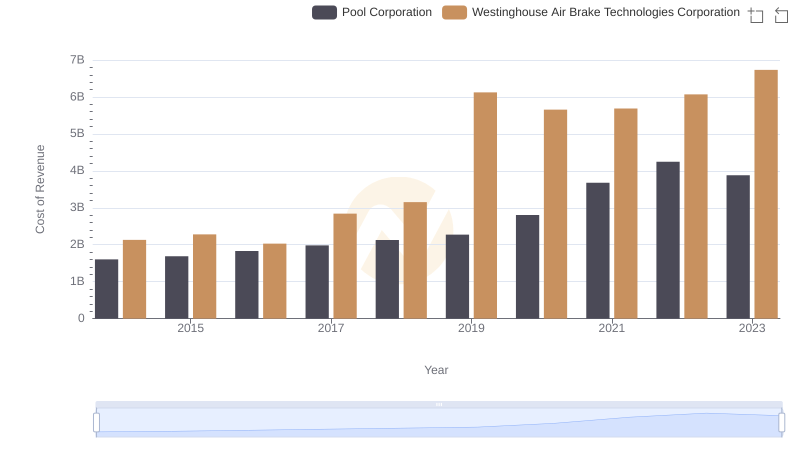
Cost of Revenue Comparison: Westinghouse Air Brake Technologies Corporation vs Pool Corporation
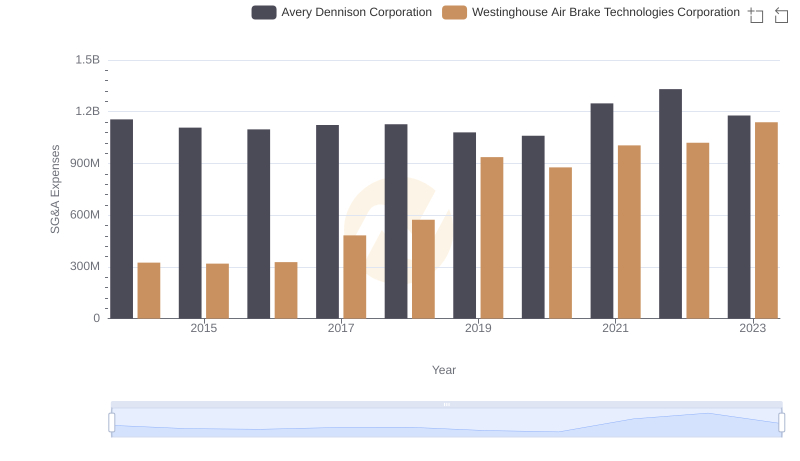
Westinghouse Air Brake Technologies Corporation vs Avery Dennison Corporation: SG&A Expense Trends
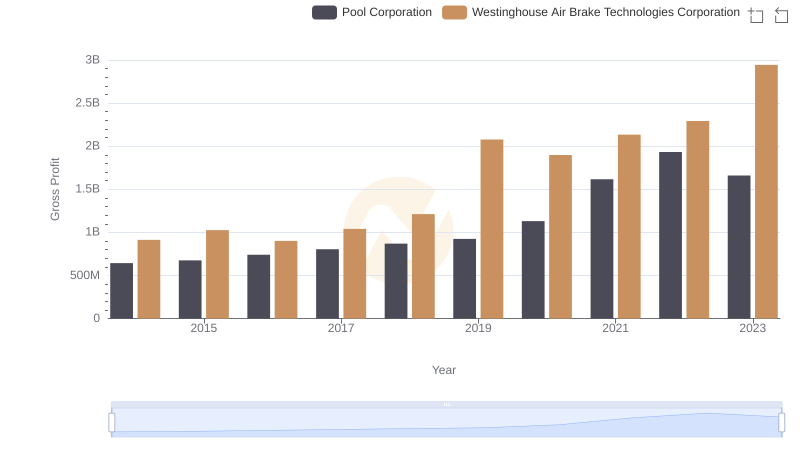
Gross Profit Comparison: Westinghouse Air Brake Technologies Corporation and Pool Corporation Trends
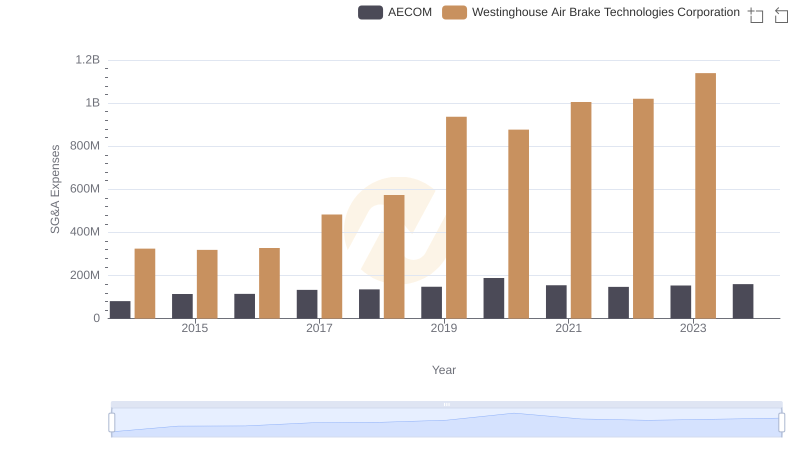
Comparing SG&A Expenses: Westinghouse Air Brake Technologies Corporation vs AECOM Trends and Insights
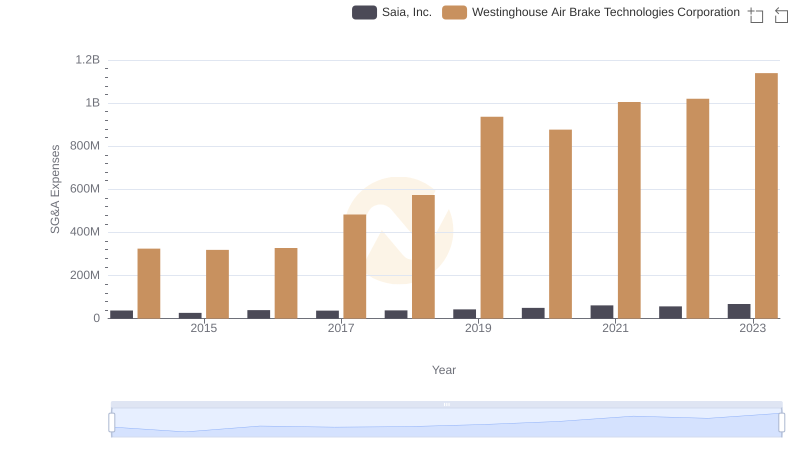
Comparing SG&A Expenses: Westinghouse Air Brake Technologies Corporation vs Saia, Inc. Trends and Insights
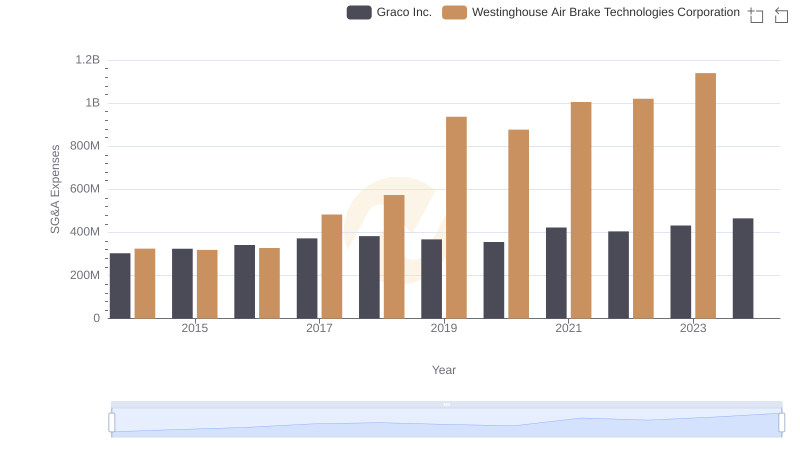
Selling, General, and Administrative Costs: Westinghouse Air Brake Technologies Corporation vs Graco Inc.
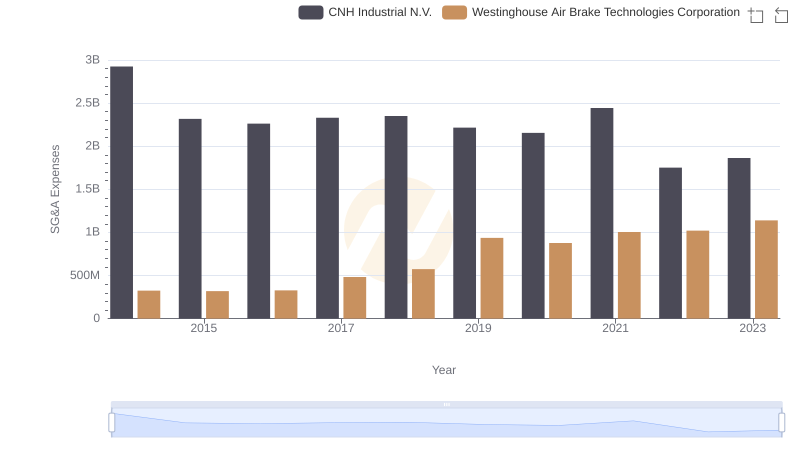
Westinghouse Air Brake Technologies Corporation or CNH Industrial N.V.: Who Manages SG&A Costs Better?
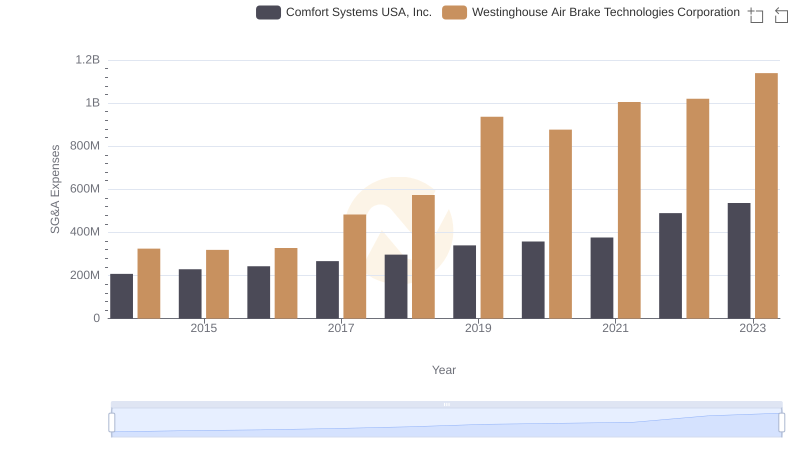
Westinghouse Air Brake Technologies Corporation vs Comfort Systems USA, Inc.: SG&A Expense Trends
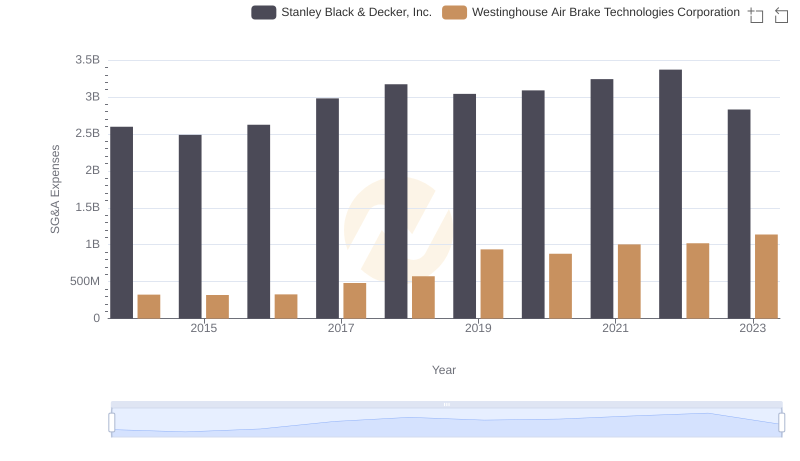
Selling, General, and Administrative Costs: Westinghouse Air Brake Technologies Corporation vs Stanley Black & Decker, Inc.
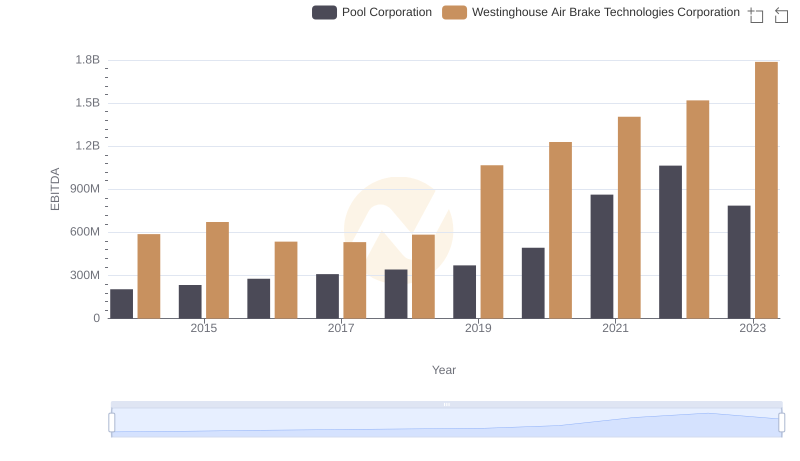
Westinghouse Air Brake Technologies Corporation vs Pool Corporation: In-Depth EBITDA Performance Comparison
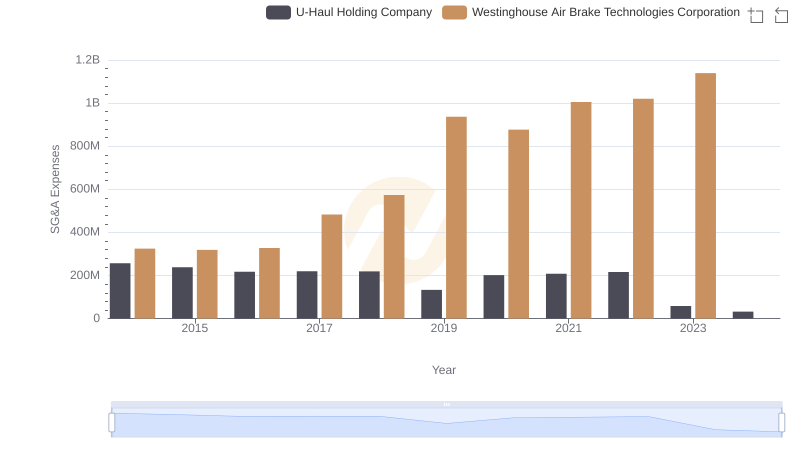
Selling, General, and Administrative Costs: Westinghouse Air Brake Technologies Corporation vs U-Haul Holding Company