| __timestamp | Pool Corporation | Westinghouse Air Brake Technologies Corporation |
|---|---|---|
| Wednesday, January 1, 2014 | 1603222000 | 2130920000 |
| Thursday, January 1, 2015 | 1687495000 | 2281845000 |
| Friday, January 1, 2016 | 1829716000 | 2029647000 |
| Sunday, January 1, 2017 | 1982899000 | 2841159000 |
| Monday, January 1, 2018 | 2127924000 | 3151816000 |
| Tuesday, January 1, 2019 | 2274592000 | 6122400000 |
| Wednesday, January 1, 2020 | 2805721000 | 5657400000 |
| Friday, January 1, 2021 | 3678492000 | 5687000000 |
| Saturday, January 1, 2022 | 4246315000 | 6070000000 |
| Sunday, January 1, 2023 | 3881551000 | 6733000000 |
| Monday, January 1, 2024 | 7021000000 |
Infusing magic into the data realm
In the ever-evolving landscape of American industry, the cost of revenue is a critical metric that reflects a company's efficiency and market strategy. This comparison between Westinghouse Air Brake Technologies Corporation and Pool Corporation from 2014 to 2023 offers a fascinating glimpse into their financial journeys.
Westinghouse Air Brake Technologies, a leader in rail technology, consistently outpaced Pool Corporation, a major player in the pool supply industry, in terms of cost of revenue. By 2023, Westinghouse's cost of revenue surged by approximately 216% from its 2014 levels, reaching a peak in 2023. In contrast, Pool Corporation saw a more modest increase of around 142% over the same period.
This data not only highlights the differing scales and operational strategies of these companies but also underscores the broader economic trends influencing their respective industries.
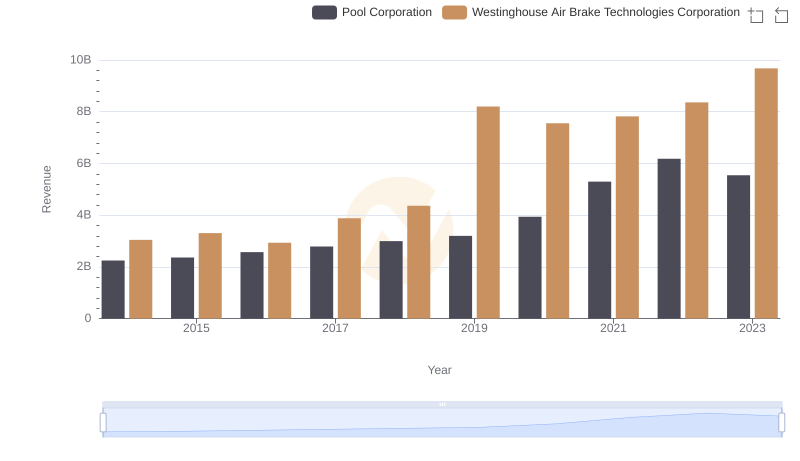
Westinghouse Air Brake Technologies Corporation and Pool Corporation: A Comprehensive Revenue Analysis
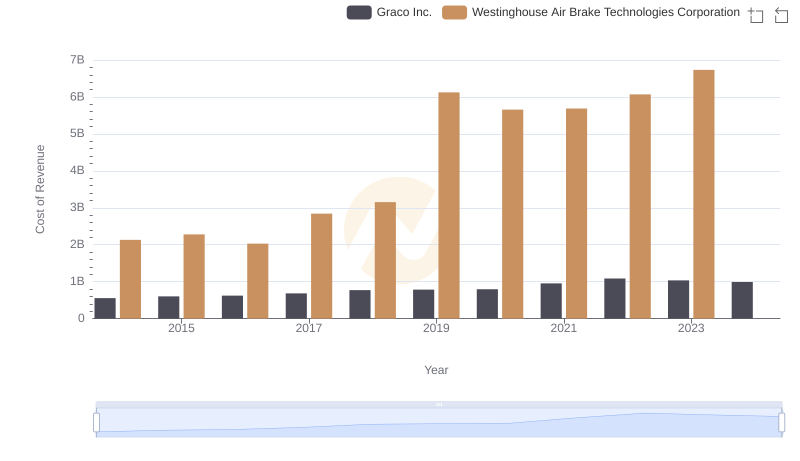
Cost of Revenue: Key Insights for Westinghouse Air Brake Technologies Corporation and Graco Inc.
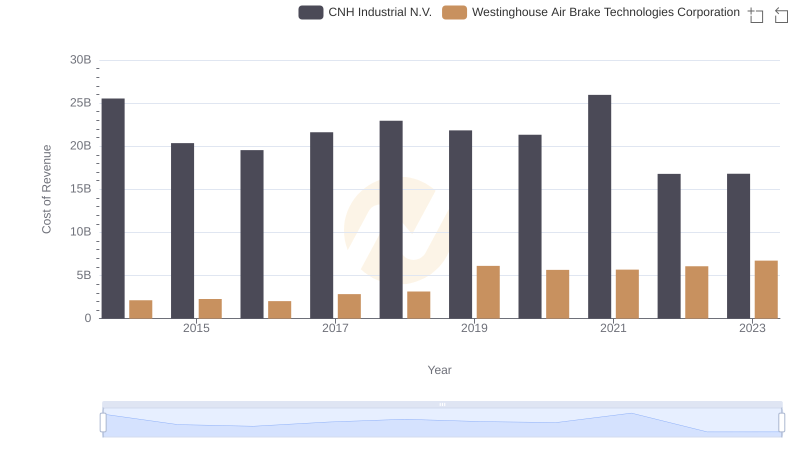
Cost Insights: Breaking Down Westinghouse Air Brake Technologies Corporation and CNH Industrial N.V.'s Expenses
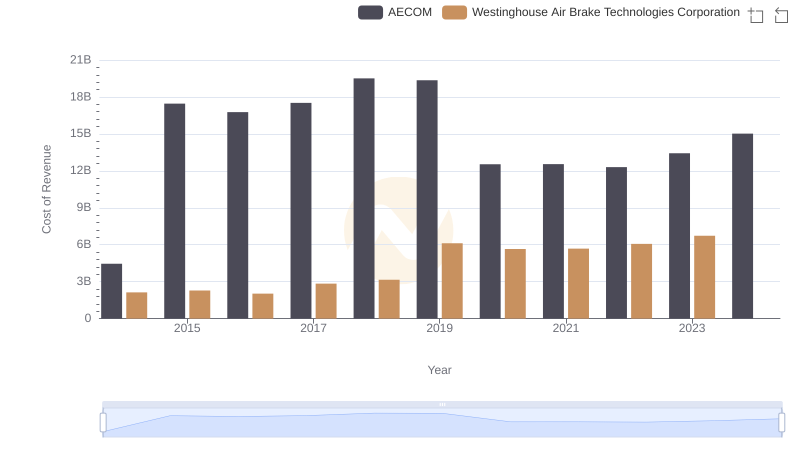
Analyzing Cost of Revenue: Westinghouse Air Brake Technologies Corporation and AECOM
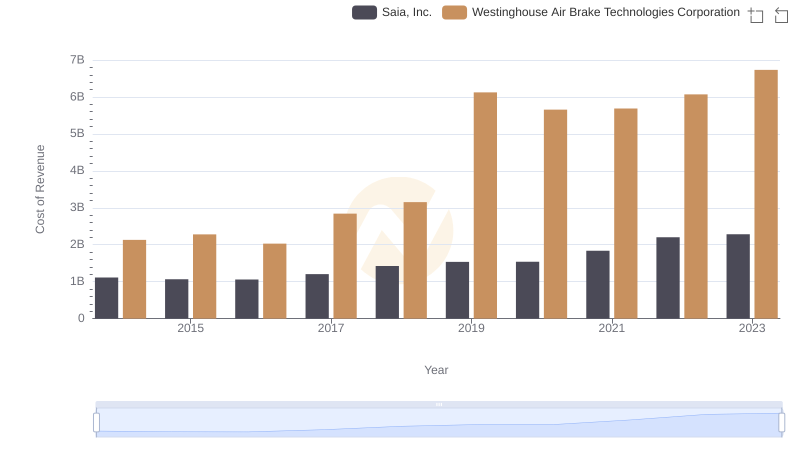
Comparing Cost of Revenue Efficiency: Westinghouse Air Brake Technologies Corporation vs Saia, Inc.
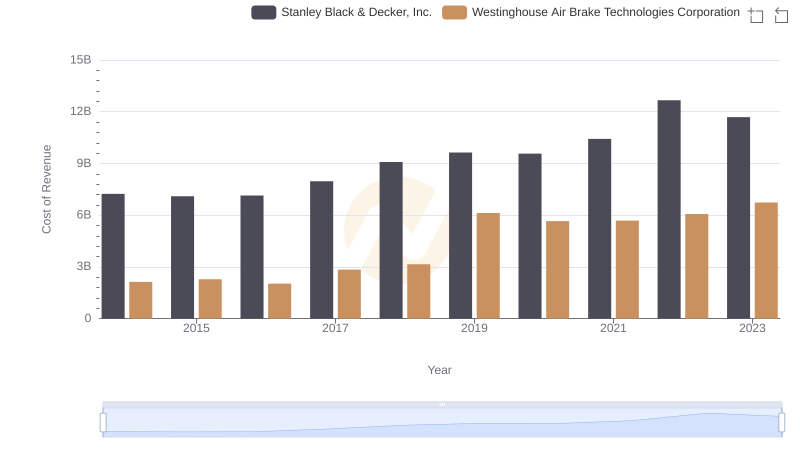
Cost of Revenue Comparison: Westinghouse Air Brake Technologies Corporation vs Stanley Black & Decker, Inc.
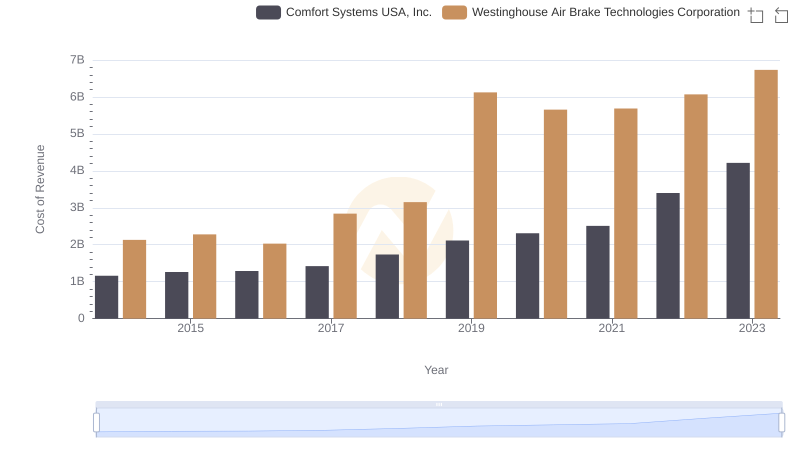
Cost of Revenue Trends: Westinghouse Air Brake Technologies Corporation vs Comfort Systems USA, Inc.
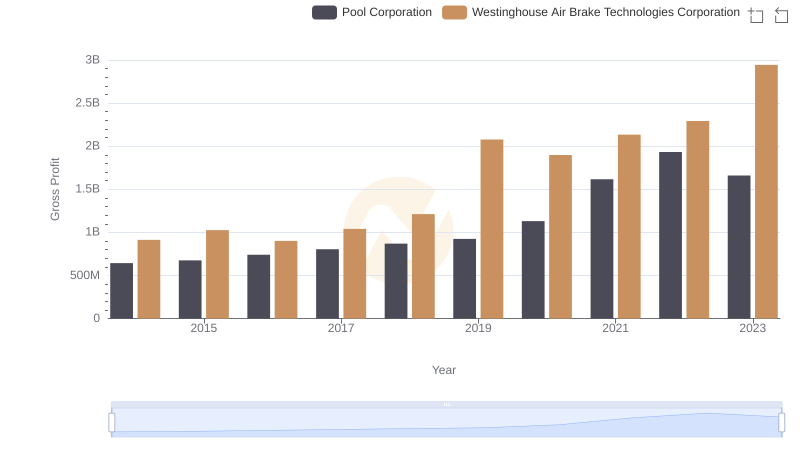
Gross Profit Comparison: Westinghouse Air Brake Technologies Corporation and Pool Corporation Trends
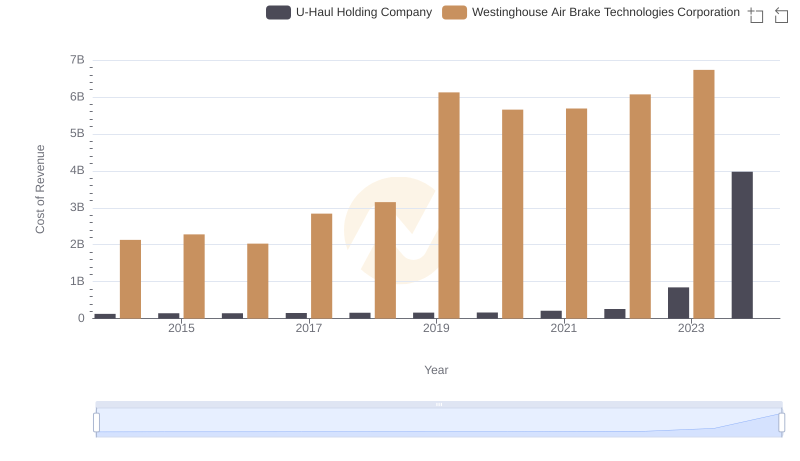
Cost Insights: Breaking Down Westinghouse Air Brake Technologies Corporation and U-Haul Holding Company's Expenses
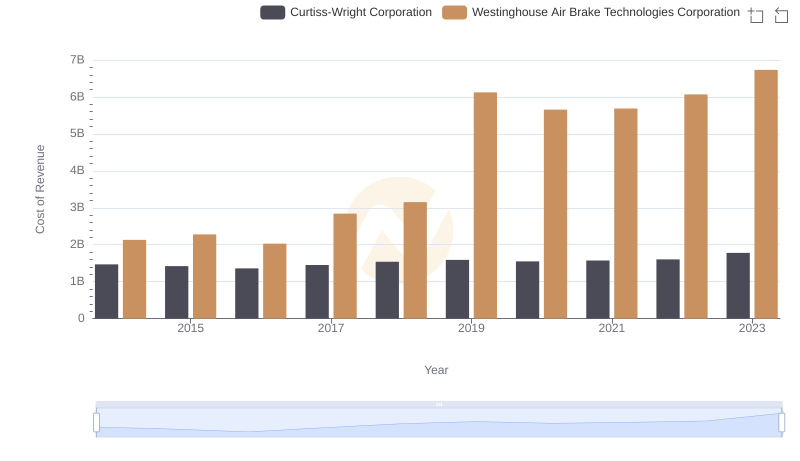
Westinghouse Air Brake Technologies Corporation vs Curtiss-Wright Corporation: Efficiency in Cost of Revenue Explored
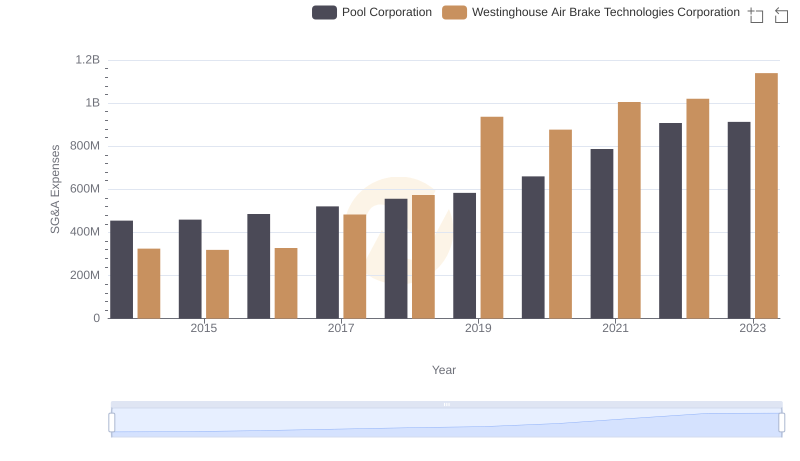
Westinghouse Air Brake Technologies Corporation vs Pool Corporation: SG&A Expense Trends
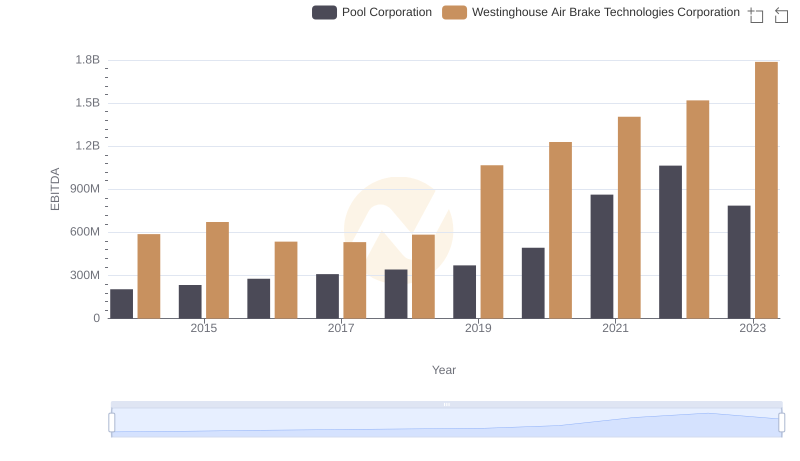
Westinghouse Air Brake Technologies Corporation vs Pool Corporation: In-Depth EBITDA Performance Comparison