| __timestamp | Comfort Systems USA, Inc. | Westinghouse Air Brake Technologies Corporation |
|---|---|---|
| Wednesday, January 1, 2014 | 207652000 | 324539000 |
| Thursday, January 1, 2015 | 228965000 | 319173000 |
| Friday, January 1, 2016 | 243201000 | 327505000 |
| Sunday, January 1, 2017 | 266586000 | 482852000 |
| Monday, January 1, 2018 | 296986000 | 573644000 |
| Tuesday, January 1, 2019 | 340005000 | 936600000 |
| Wednesday, January 1, 2020 | 357777000 | 877100000 |
| Friday, January 1, 2021 | 376309000 | 1005000000 |
| Saturday, January 1, 2022 | 489344000 | 1020000000 |
| Sunday, January 1, 2023 | 536188999 | 1139000000 |
| Monday, January 1, 2024 | 1248000000 |
Unlocking the unknown
In the competitive landscape of industrial services, understanding financial trends is crucial. Over the past decade, Westinghouse Air Brake Technologies Corporation and Comfort Systems USA, Inc. have shown distinct trajectories in their Selling, General, and Administrative (SG&A) expenses. From 2014 to 2023, Westinghouse's SG&A expenses surged by approximately 250%, peaking at over $1.1 billion in 2023. This growth reflects their aggressive expansion and strategic investments. In contrast, Comfort Systems USA, Inc. experienced a more moderate increase of around 160%, reaching $536 million in the same period. This steady rise indicates a focus on sustainable growth and operational efficiency. These trends highlight the differing strategies of these industry players, offering insights into their financial health and market positioning. As businesses navigate economic challenges, monitoring such expenses can provide valuable foresight into future performance.
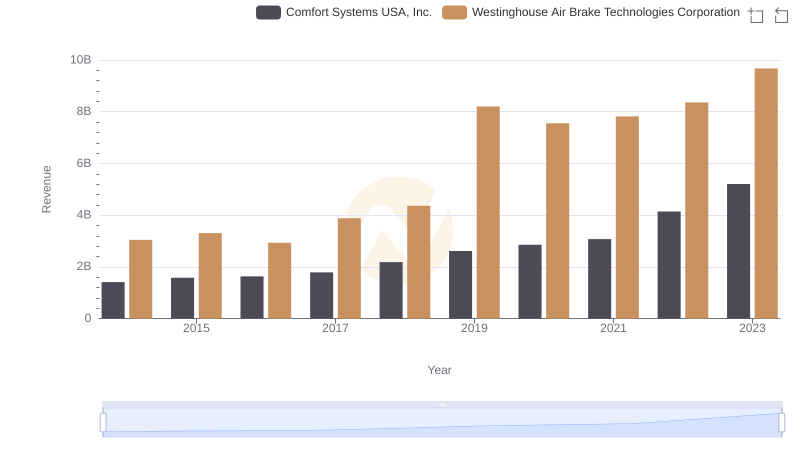
Revenue Insights: Westinghouse Air Brake Technologies Corporation and Comfort Systems USA, Inc. Performance Compared
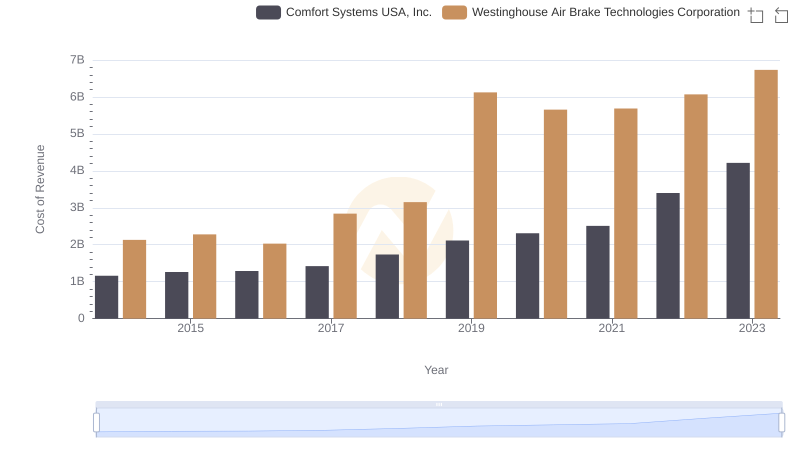
Cost of Revenue Trends: Westinghouse Air Brake Technologies Corporation vs Comfort Systems USA, Inc.
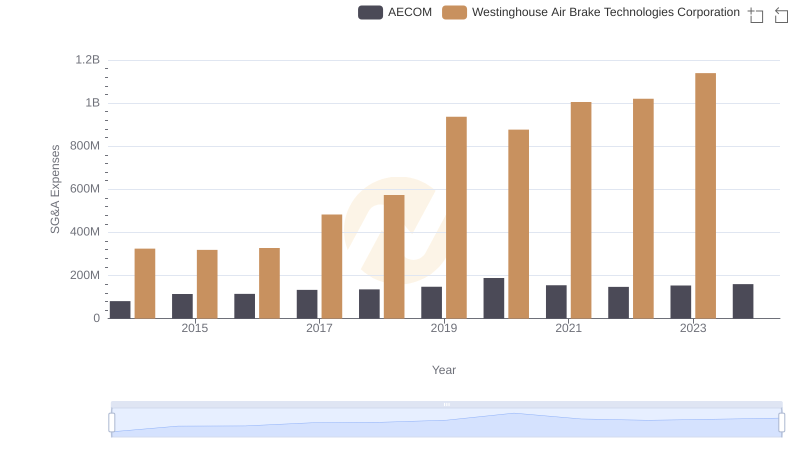
Comparing SG&A Expenses: Westinghouse Air Brake Technologies Corporation vs AECOM Trends and Insights
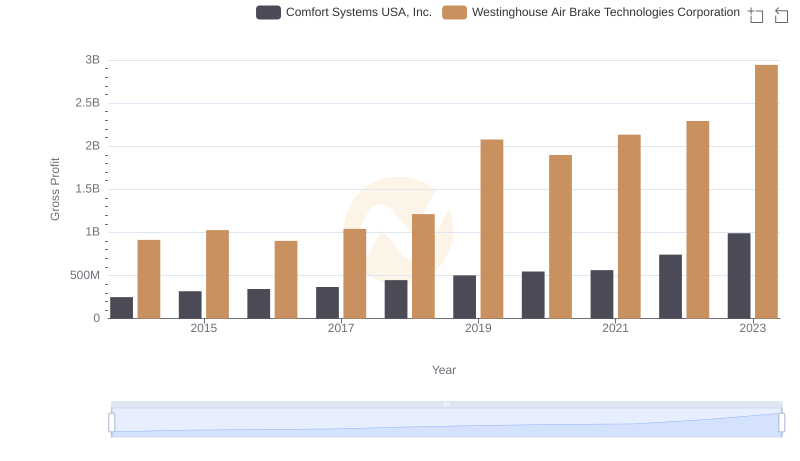
Westinghouse Air Brake Technologies Corporation and Comfort Systems USA, Inc.: A Detailed Gross Profit Analysis
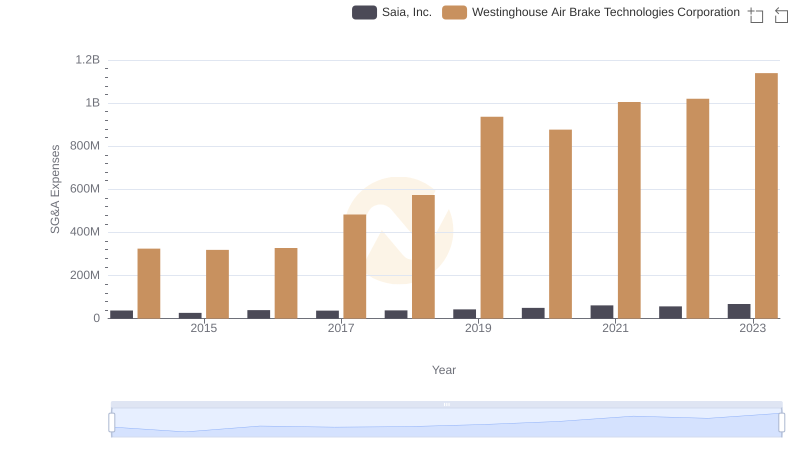
Comparing SG&A Expenses: Westinghouse Air Brake Technologies Corporation vs Saia, Inc. Trends and Insights
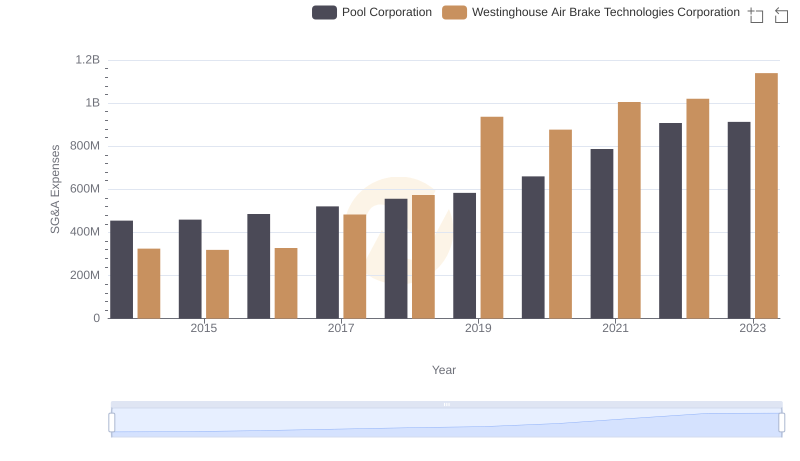
Westinghouse Air Brake Technologies Corporation vs Pool Corporation: SG&A Expense Trends
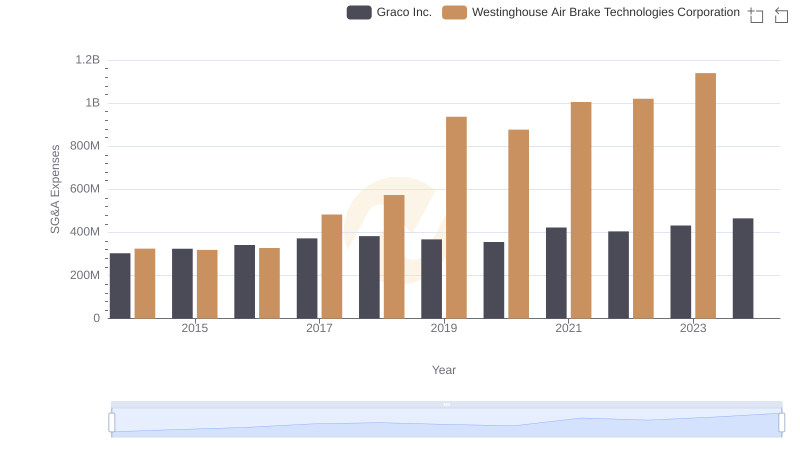
Selling, General, and Administrative Costs: Westinghouse Air Brake Technologies Corporation vs Graco Inc.
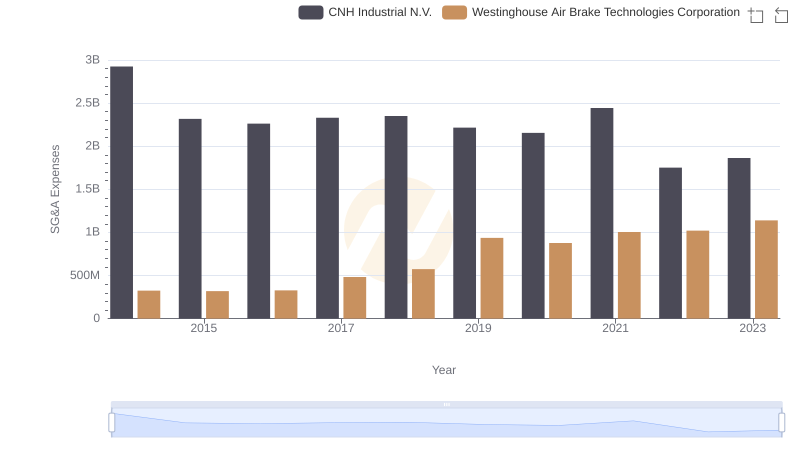
Westinghouse Air Brake Technologies Corporation or CNH Industrial N.V.: Who Manages SG&A Costs Better?
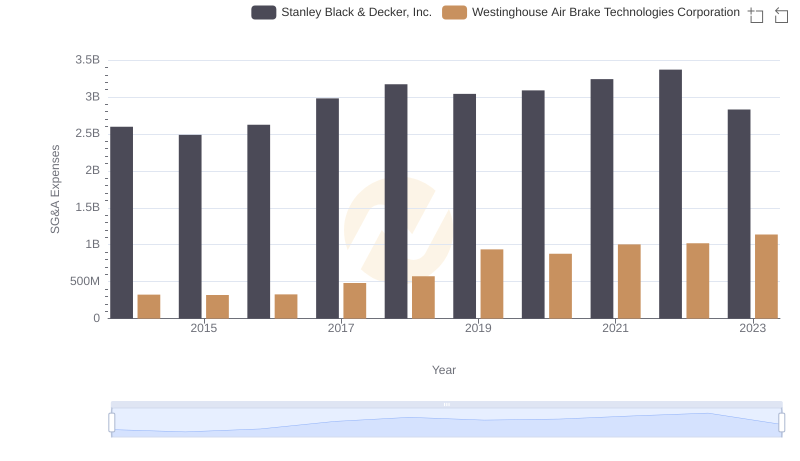
Selling, General, and Administrative Costs: Westinghouse Air Brake Technologies Corporation vs Stanley Black & Decker, Inc.
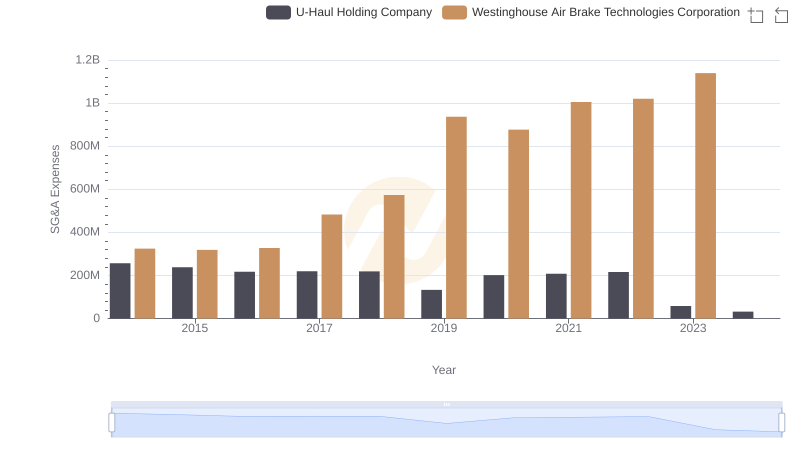
Selling, General, and Administrative Costs: Westinghouse Air Brake Technologies Corporation vs U-Haul Holding Company
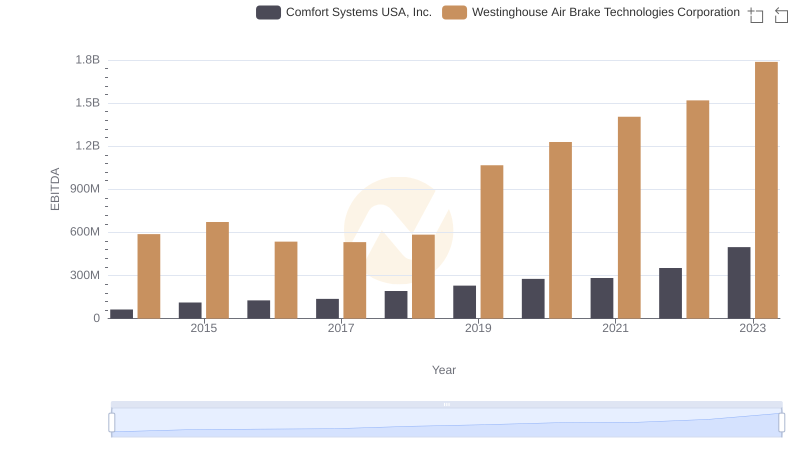
Westinghouse Air Brake Technologies Corporation vs Comfort Systems USA, Inc.: In-Depth EBITDA Performance Comparison
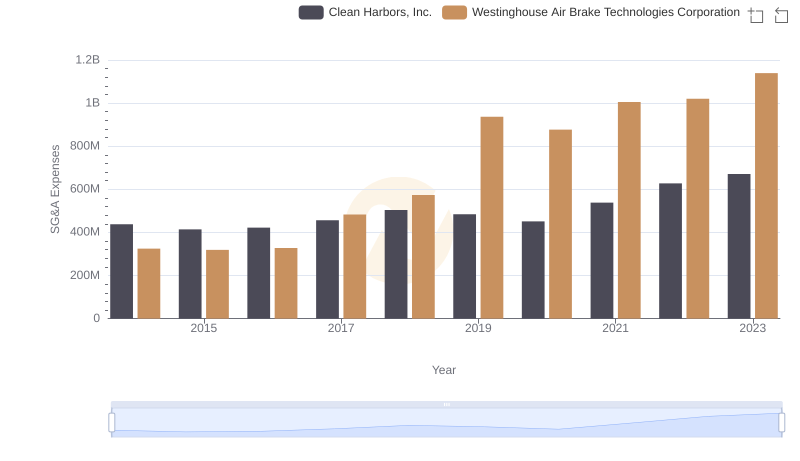
Operational Costs Compared: SG&A Analysis of Westinghouse Air Brake Technologies Corporation and Clean Harbors, Inc.