| __timestamp | Pool Corporation | Westinghouse Air Brake Technologies Corporation |
|---|---|---|
| Wednesday, January 1, 2014 | 2246562000 | 3044454000 |
| Thursday, January 1, 2015 | 2363139000 | 3307998000 |
| Friday, January 1, 2016 | 2570803000 | 2931188000 |
| Sunday, January 1, 2017 | 2788188000 | 3881756000 |
| Monday, January 1, 2018 | 2998097000 | 4363547000 |
| Tuesday, January 1, 2019 | 3199517000 | 8200000000 |
| Wednesday, January 1, 2020 | 3936623000 | 7556100000 |
| Friday, January 1, 2021 | 5295584000 | 7822000000 |
| Saturday, January 1, 2022 | 6179727000 | 8362000000 |
| Sunday, January 1, 2023 | 5541595000 | 9677000000 |
| Monday, January 1, 2024 | 10387000000 |
Infusing magic into the data realm
In the past decade, Westinghouse Air Brake Technologies Corporation and Pool Corporation have demonstrated remarkable revenue trajectories. From 2014 to 2023, Westinghouse Air Brake Technologies saw its revenue grow by over 218%, peaking at approximately $9.7 billion in 2023. This growth reflects the company's strategic expansions and innovations in the transportation sector.
Meanwhile, Pool Corporation, a leader in the pool supply industry, experienced a robust 147% increase in revenue, reaching around $5.5 billion in 2023. This growth underscores the rising demand for leisure and home improvement products, especially during the pandemic years.
Both companies have shown resilience and adaptability, with Westinghouse consistently outperforming Pool Corporation in revenue. This analysis highlights the dynamic nature of these industries and the companies' ability to capitalize on market trends.
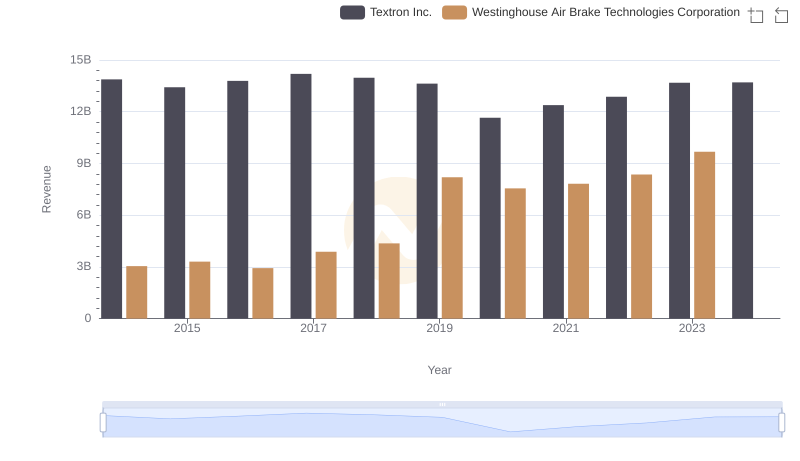
Westinghouse Air Brake Technologies Corporation or Textron Inc.: Who Leads in Yearly Revenue?
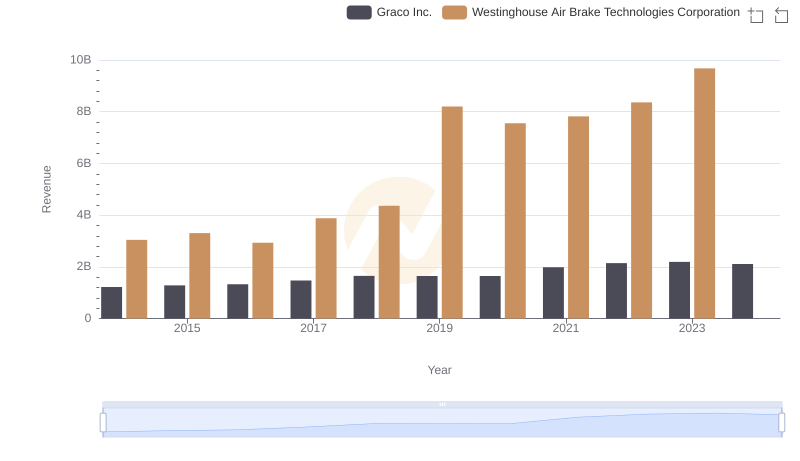
Westinghouse Air Brake Technologies Corporation vs Graco Inc.: Annual Revenue Growth Compared

Revenue Insights: Westinghouse Air Brake Technologies Corporation and CNH Industrial N.V. Performance Compared
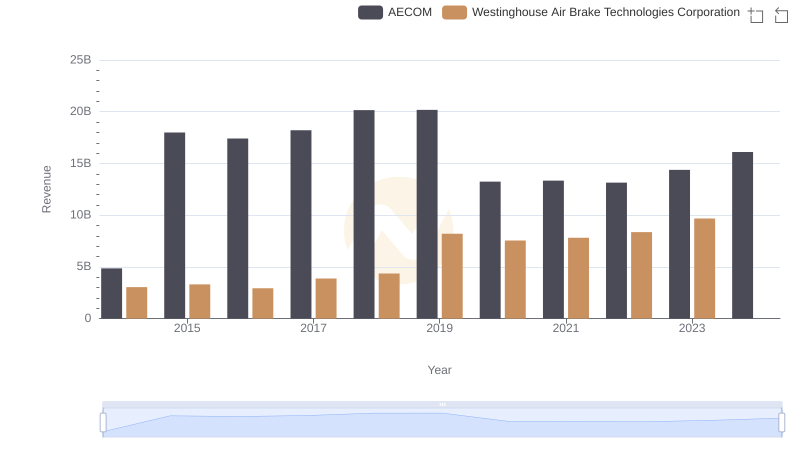
Westinghouse Air Brake Technologies Corporation vs AECOM: Annual Revenue Growth Compared
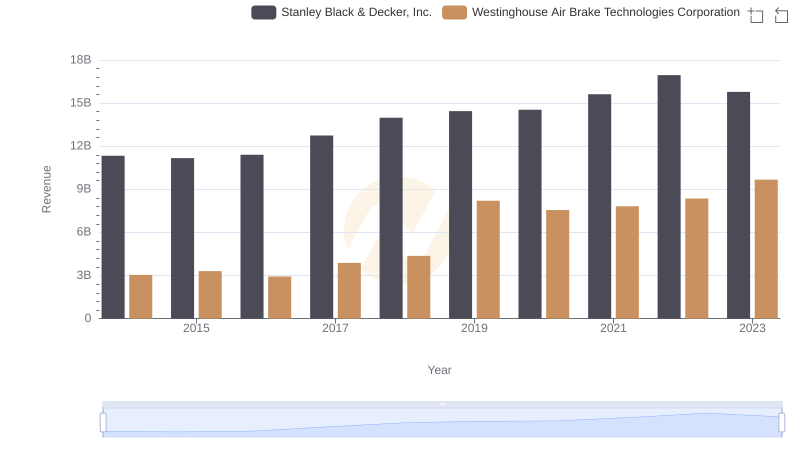
Breaking Down Revenue Trends: Westinghouse Air Brake Technologies Corporation vs Stanley Black & Decker, Inc.

Westinghouse Air Brake Technologies Corporation and Saia, Inc.: A Comprehensive Revenue Analysis
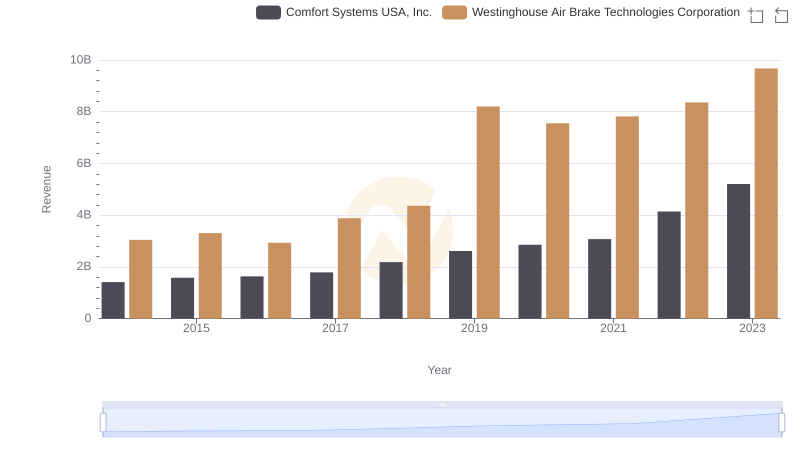
Revenue Insights: Westinghouse Air Brake Technologies Corporation and Comfort Systems USA, Inc. Performance Compared
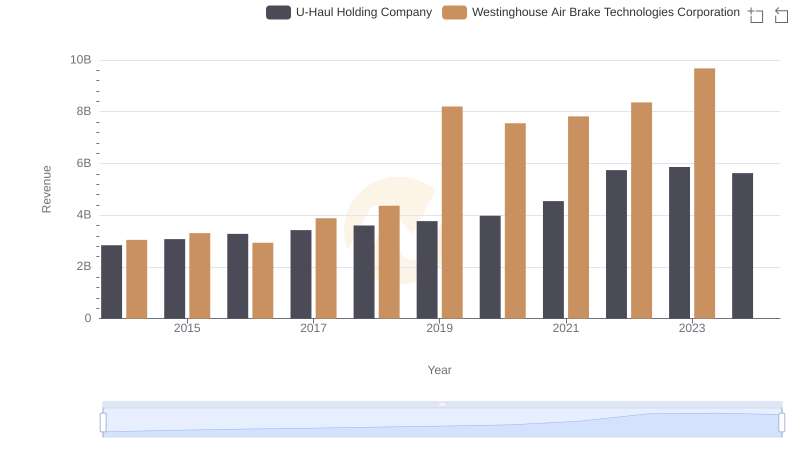
Westinghouse Air Brake Technologies Corporation vs U-Haul Holding Company: Annual Revenue Growth Compared
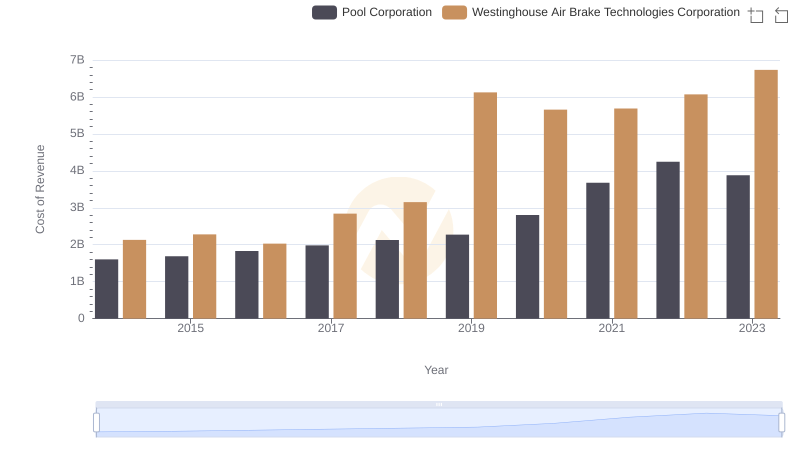
Cost of Revenue Comparison: Westinghouse Air Brake Technologies Corporation vs Pool Corporation
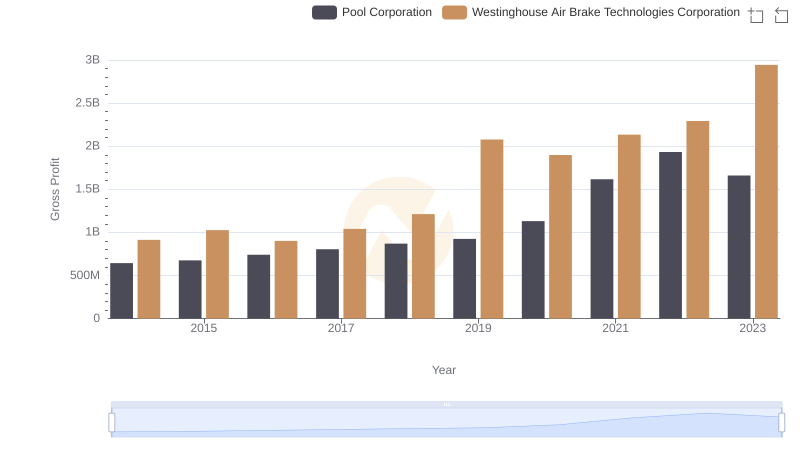
Gross Profit Comparison: Westinghouse Air Brake Technologies Corporation and Pool Corporation Trends
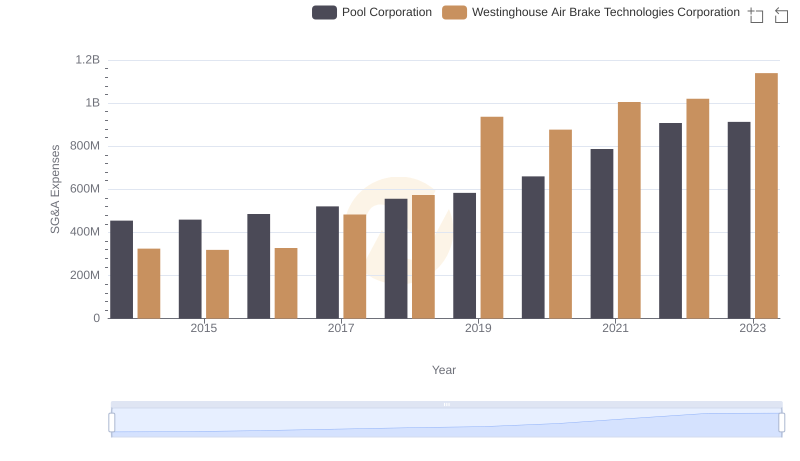
Westinghouse Air Brake Technologies Corporation vs Pool Corporation: SG&A Expense Trends
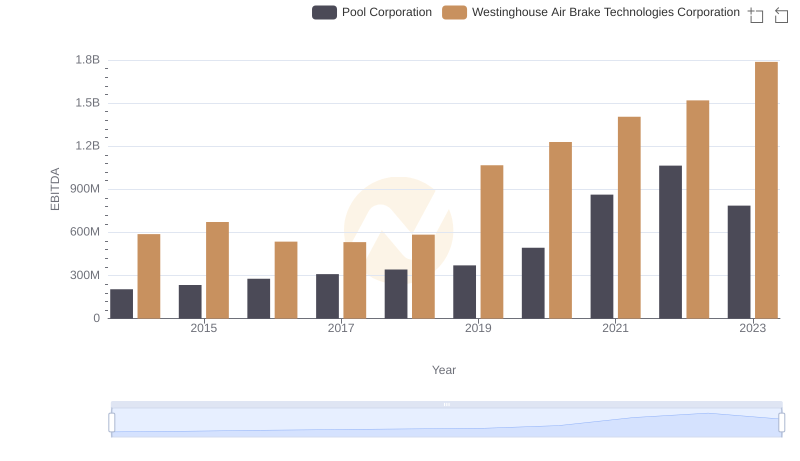
Westinghouse Air Brake Technologies Corporation vs Pool Corporation: In-Depth EBITDA Performance Comparison