| __timestamp | Masco Corporation | Watsco, Inc. |
|---|---|---|
| Wednesday, January 1, 2014 | 6134000000 | 2988138000 |
| Thursday, January 1, 2015 | 4889000000 | 3105882000 |
| Friday, January 1, 2016 | 4901000000 | 3186118000 |
| Sunday, January 1, 2017 | 5033000000 | 3276296000 |
| Monday, January 1, 2018 | 5670000000 | 3426401000 |
| Tuesday, January 1, 2019 | 4336000000 | 3613406000 |
| Wednesday, January 1, 2020 | 4601000000 | 3832107000 |
| Friday, January 1, 2021 | 5512000000 | 4612647000 |
| Saturday, January 1, 2022 | 5967000000 | 5244055000 |
| Sunday, January 1, 2023 | 5131000000 | 5291627000 |
| Monday, January 1, 2024 | 4997000000 | 5573604000 |
In pursuit of knowledge
In the competitive landscape of the HVAC and home improvement sectors, cost efficiency is paramount. From 2014 to 2023, Watsco, Inc. and Masco Corporation have demonstrated contrasting trends in their cost of revenue. Watsco, Inc. has shown a remarkable 77% increase in cost efficiency, with its cost of revenue rising from approximately $3 billion in 2014 to over $5.2 billion in 2023. Meanwhile, Masco Corporation experienced a more modest 16% increase, peaking at $6.1 billion in 2014 and stabilizing around $5.1 billion by 2023. This data suggests that Watsco, Inc. has been more aggressive in scaling its operations, potentially reflecting strategic investments in growth and market expansion. As the industry evolves, these insights provide a window into the operational strategies of two major players, offering valuable lessons in balancing growth with cost management.
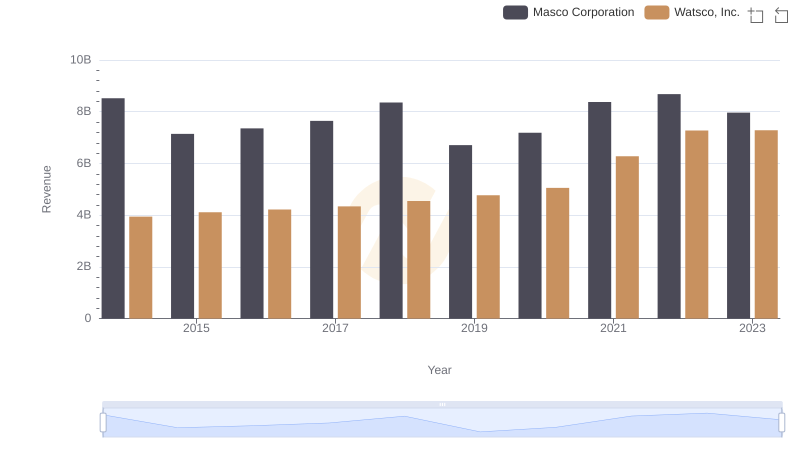
Revenue Insights: Watsco, Inc. and Masco Corporation Performance Compared
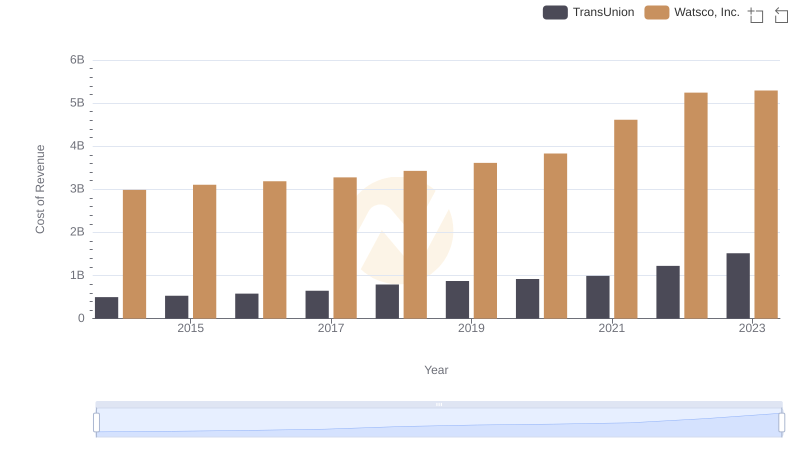
Cost Insights: Breaking Down Watsco, Inc. and TransUnion's Expenses
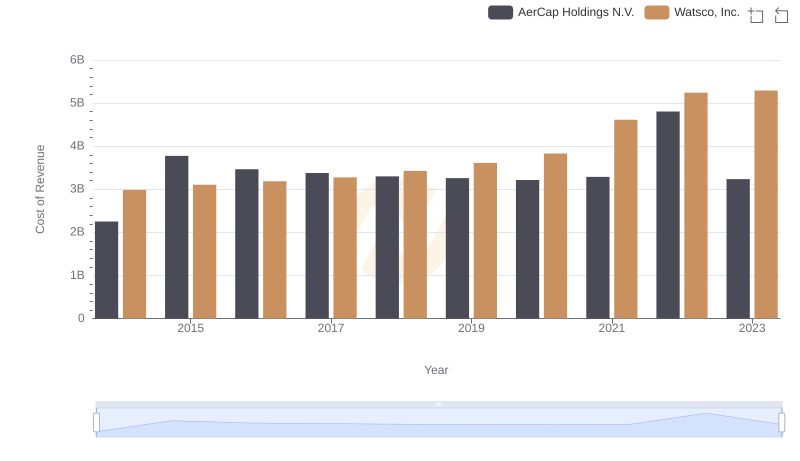
Cost of Revenue Comparison: Watsco, Inc. vs AerCap Holdings N.V.
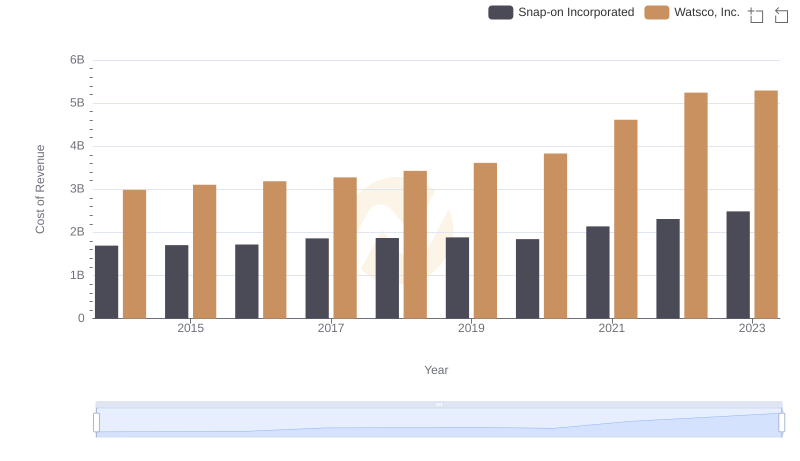
Cost Insights: Breaking Down Watsco, Inc. and Snap-on Incorporated's Expenses
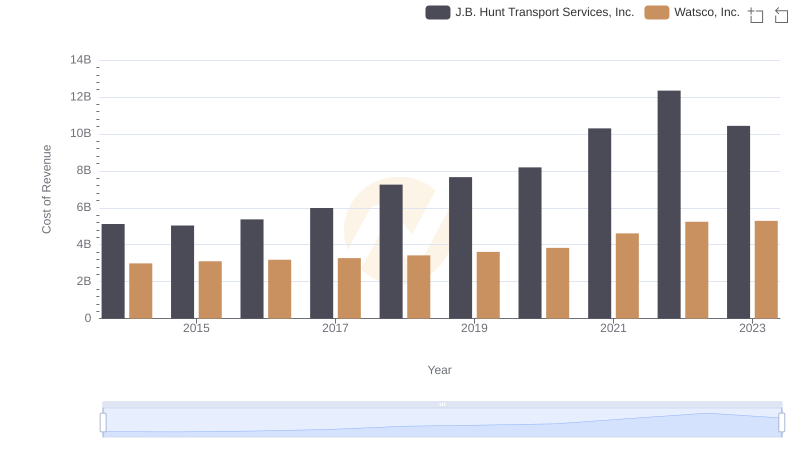
Cost Insights: Breaking Down Watsco, Inc. and J.B. Hunt Transport Services, Inc.'s Expenses
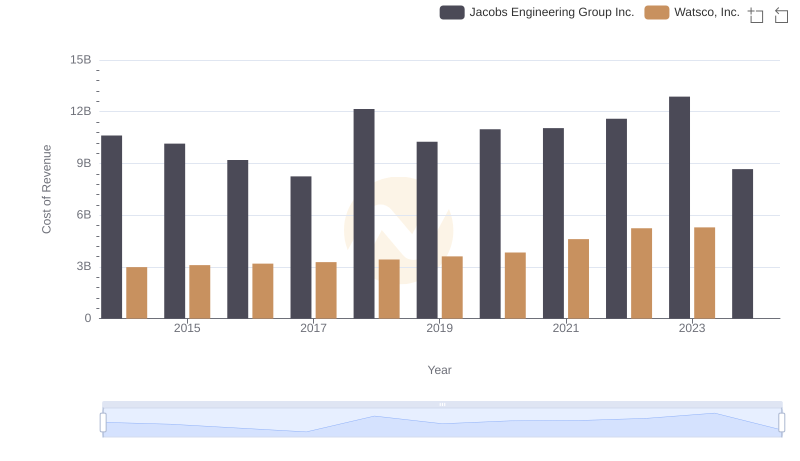
Cost of Revenue: Key Insights for Watsco, Inc. and Jacobs Engineering Group Inc.
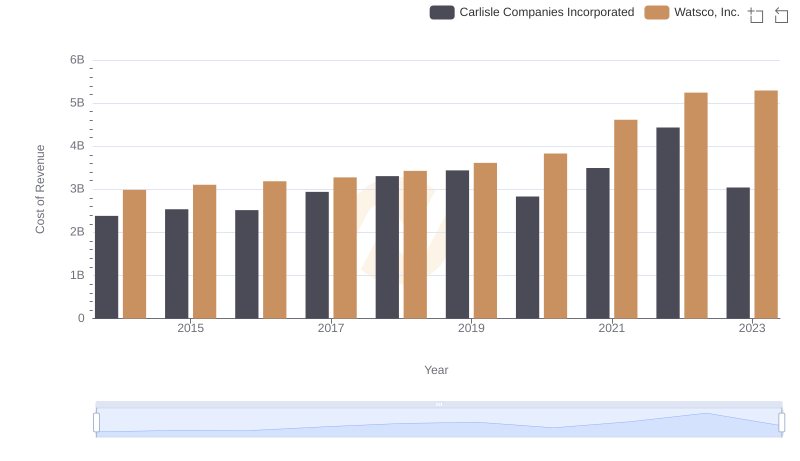
Cost Insights: Breaking Down Watsco, Inc. and Carlisle Companies Incorporated's Expenses
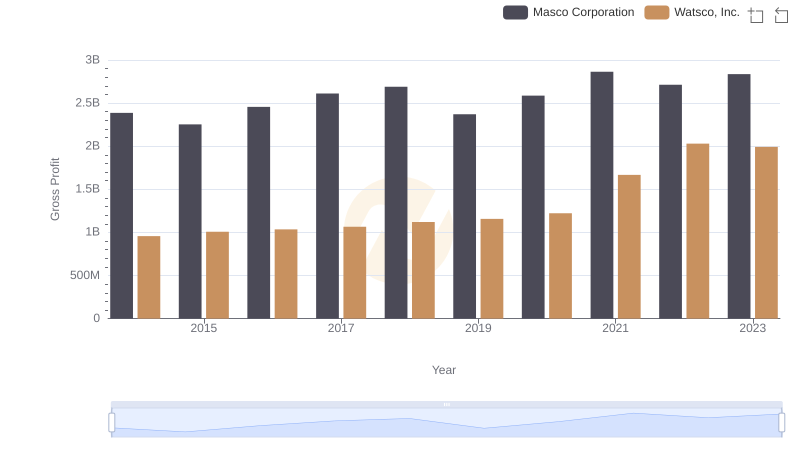
Gross Profit Trends Compared: Watsco, Inc. vs Masco Corporation
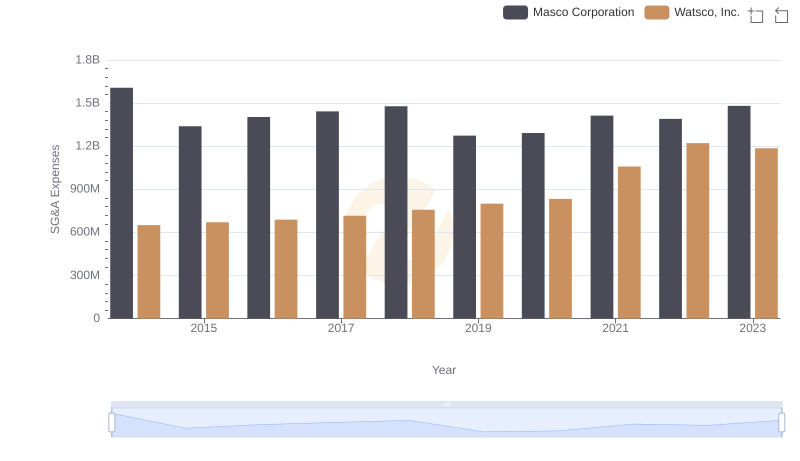
SG&A Efficiency Analysis: Comparing Watsco, Inc. and Masco Corporation
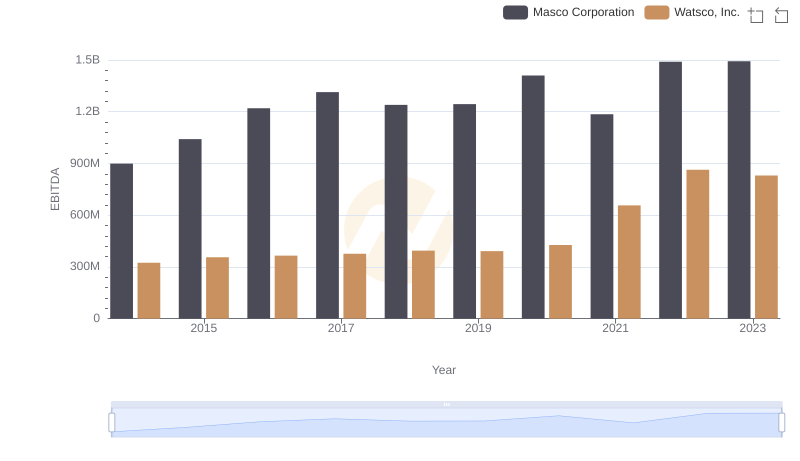
Comparative EBITDA Analysis: Watsco, Inc. vs Masco Corporation