| __timestamp | TransUnion | Watsco, Inc. |
|---|---|---|
| Wednesday, January 1, 2014 | 499100000 | 2988138000 |
| Thursday, January 1, 2015 | 531600000 | 3105882000 |
| Friday, January 1, 2016 | 579100000 | 3186118000 |
| Sunday, January 1, 2017 | 645700000 | 3276296000 |
| Monday, January 1, 2018 | 790100000 | 3426401000 |
| Tuesday, January 1, 2019 | 874100000 | 3613406000 |
| Wednesday, January 1, 2020 | 920400000 | 3832107000 |
| Friday, January 1, 2021 | 991600000 | 4612647000 |
| Saturday, January 1, 2022 | 1222900000 | 5244055000 |
| Sunday, January 1, 2023 | 1517300000 | 5291627000 |
| Monday, January 1, 2024 | 0 | 5573604000 |
Unleashing the power of data
In the ever-evolving landscape of corporate finance, understanding cost structures is pivotal. This analysis delves into the cost of revenue trends for Watsco, Inc. and TransUnion from 2014 to 2023. Over this period, Watsco, Inc. consistently outpaced TransUnion, with its cost of revenue peaking at approximately $5.29 billion in 2023, marking a 77% increase from 2014. In contrast, TransUnion's expenses grew by 204%, reaching around $1.52 billion in 2023. This stark difference highlights Watsco's larger scale of operations, while TransUnion's rapid growth reflects its dynamic market strategies. The data underscores the importance of strategic cost management in maintaining competitive advantage. As businesses navigate the complexities of the modern economy, these insights offer a window into the financial strategies of industry leaders.
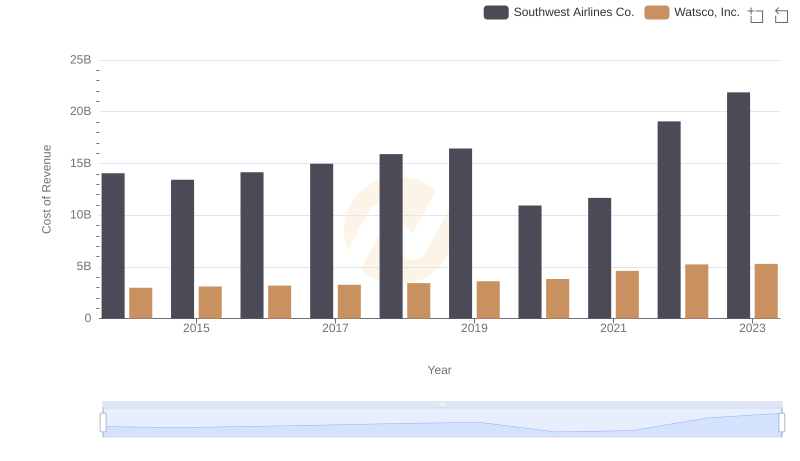
Analyzing Cost of Revenue: Watsco, Inc. and Southwest Airlines Co.
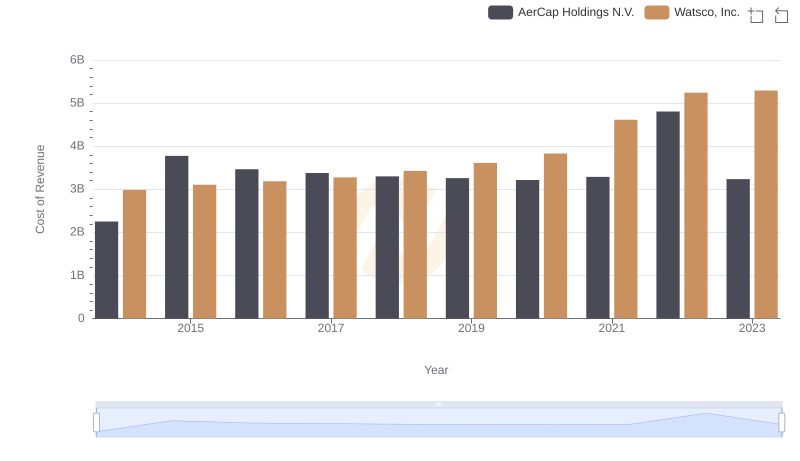
Cost of Revenue Comparison: Watsco, Inc. vs AerCap Holdings N.V.
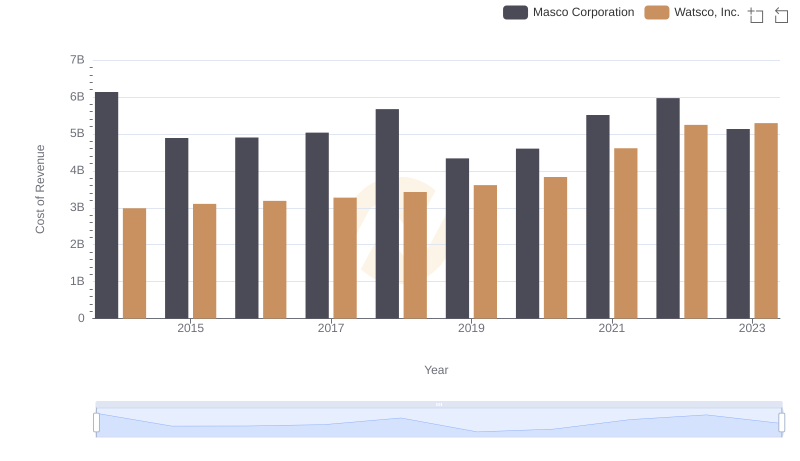
Watsco, Inc. vs Masco Corporation: Efficiency in Cost of Revenue Explored
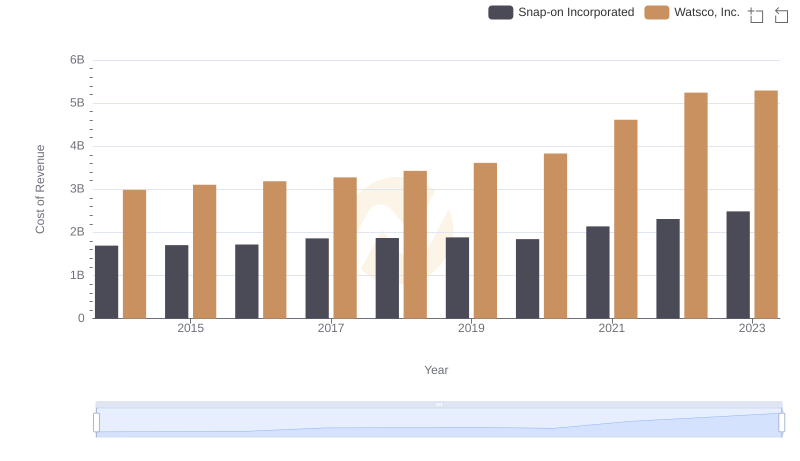
Cost Insights: Breaking Down Watsco, Inc. and Snap-on Incorporated's Expenses
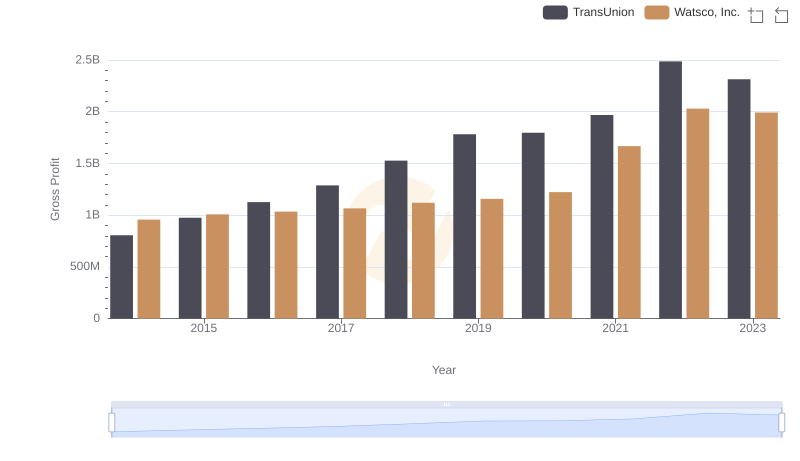
Gross Profit Comparison: Watsco, Inc. and TransUnion Trends
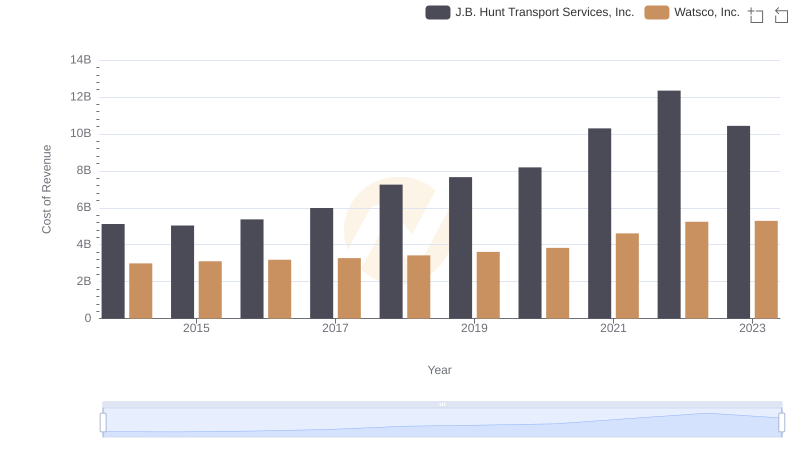
Cost Insights: Breaking Down Watsco, Inc. and J.B. Hunt Transport Services, Inc.'s Expenses
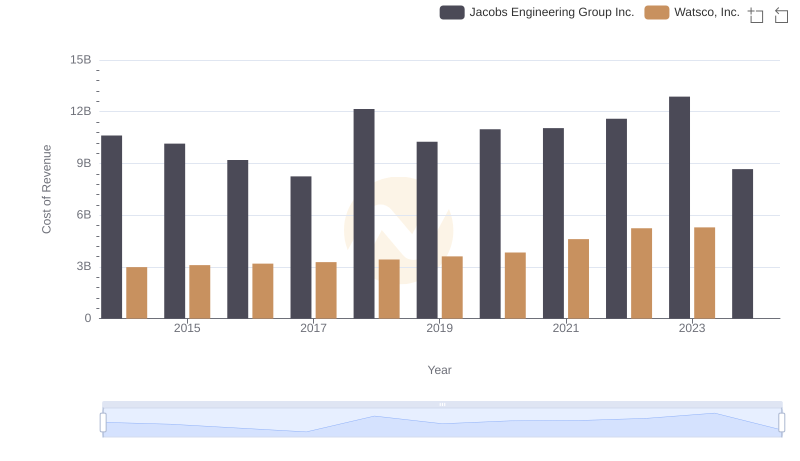
Cost of Revenue: Key Insights for Watsco, Inc. and Jacobs Engineering Group Inc.
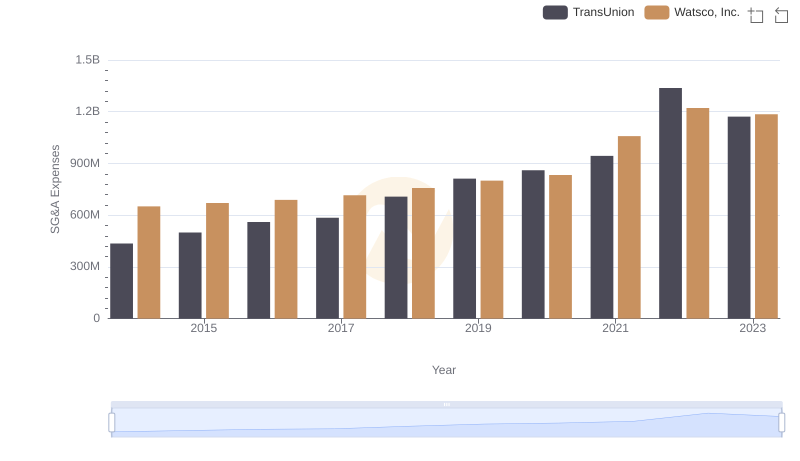
Breaking Down SG&A Expenses: Watsco, Inc. vs TransUnion