| __timestamp | Jacobs Engineering Group Inc. | Watsco, Inc. |
|---|---|---|
| Wednesday, January 1, 2014 | 10621373000 | 2988138000 |
| Thursday, January 1, 2015 | 10146494000 | 3105882000 |
| Friday, January 1, 2016 | 9196326000 | 3186118000 |
| Sunday, January 1, 2017 | 8250536000 | 3276296000 |
| Monday, January 1, 2018 | 12156276000 | 3426401000 |
| Tuesday, January 1, 2019 | 10260840000 | 3613406000 |
| Wednesday, January 1, 2020 | 10980307000 | 3832107000 |
| Friday, January 1, 2021 | 11048860000 | 4612647000 |
| Saturday, January 1, 2022 | 11595785000 | 5244055000 |
| Sunday, January 1, 2023 | 12879099000 | 5291627000 |
| Monday, January 1, 2024 | 8668185000 | 5573604000 |
Data in motion
In the ever-evolving landscape of industrial giants, understanding cost dynamics is crucial. From 2014 to 2023, Jacobs Engineering Group Inc. and Watsco, Inc. have showcased intriguing trends in their cost of revenue. Jacobs Engineering, a leader in engineering services, saw a notable fluctuation, peaking in 2023 with a 22% increase from its 2014 figures. Meanwhile, Watsco, a major player in HVAC distribution, experienced a steady rise, culminating in a 77% growth over the same period. Notably, 2024 data for Watsco remains elusive, hinting at potential shifts. These insights underscore the strategic maneuvers of these companies in managing operational costs amidst market challenges. As we delve deeper into these trends, stakeholders can glean valuable lessons on cost management and strategic planning.
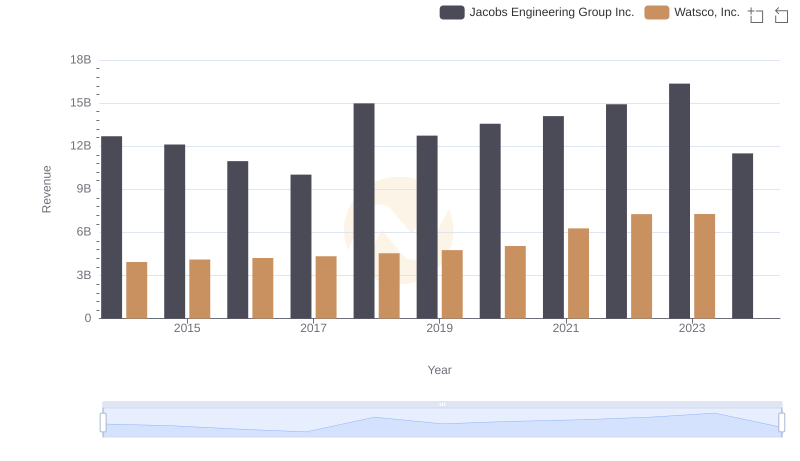
Breaking Down Revenue Trends: Watsco, Inc. vs Jacobs Engineering Group Inc.
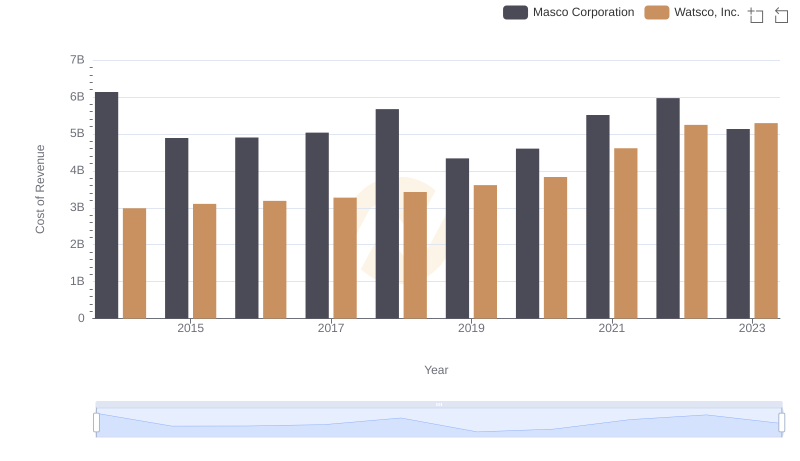
Watsco, Inc. vs Masco Corporation: Efficiency in Cost of Revenue Explored
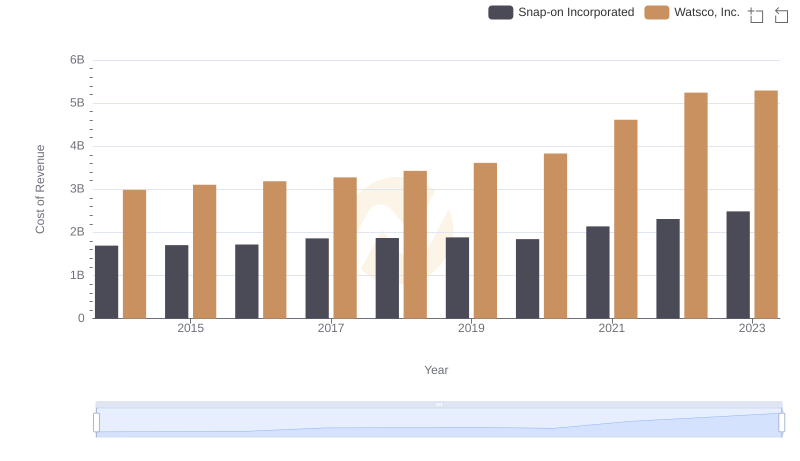
Cost Insights: Breaking Down Watsco, Inc. and Snap-on Incorporated's Expenses
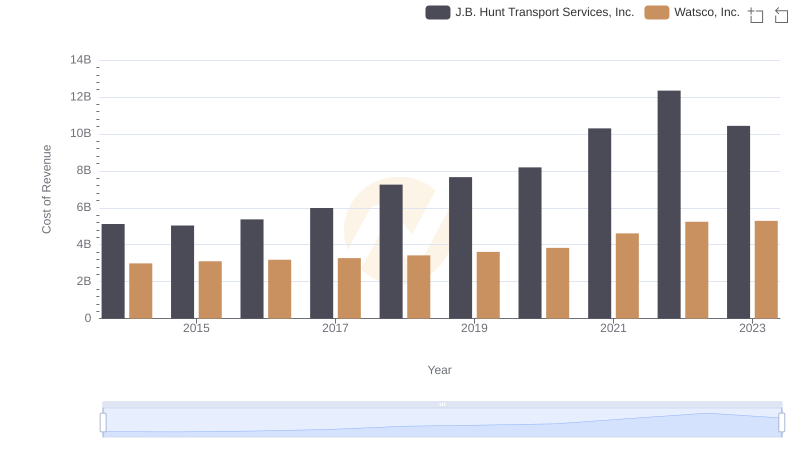
Cost Insights: Breaking Down Watsco, Inc. and J.B. Hunt Transport Services, Inc.'s Expenses
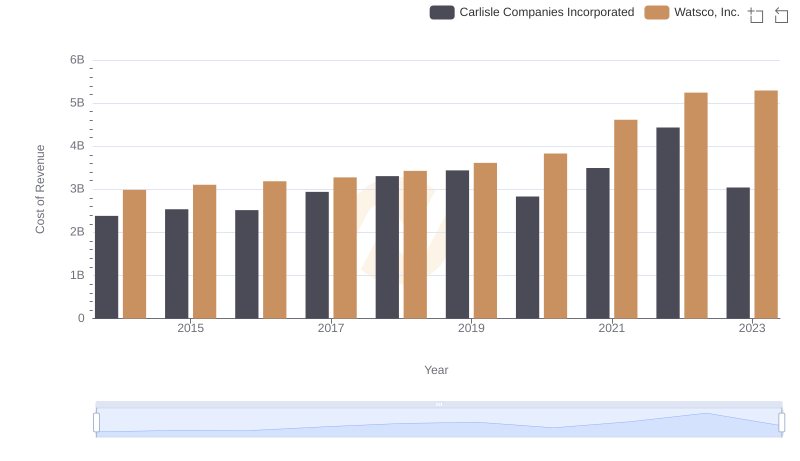
Cost Insights: Breaking Down Watsco, Inc. and Carlisle Companies Incorporated's Expenses
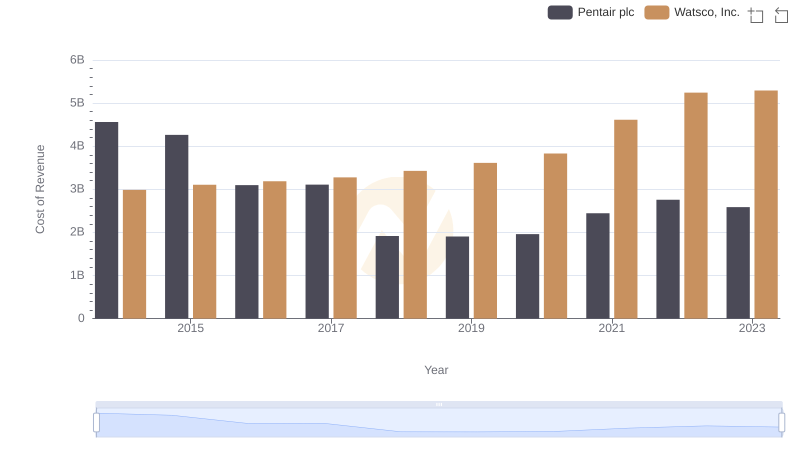
Cost of Revenue Trends: Watsco, Inc. vs Pentair plc
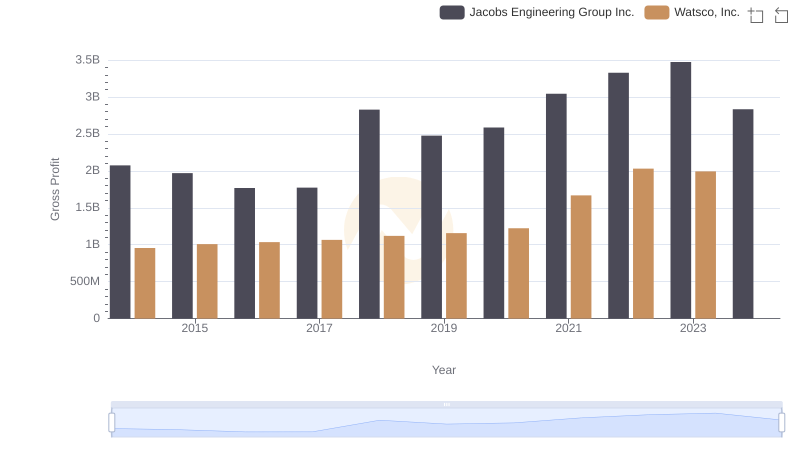
Key Insights on Gross Profit: Watsco, Inc. vs Jacobs Engineering Group Inc.
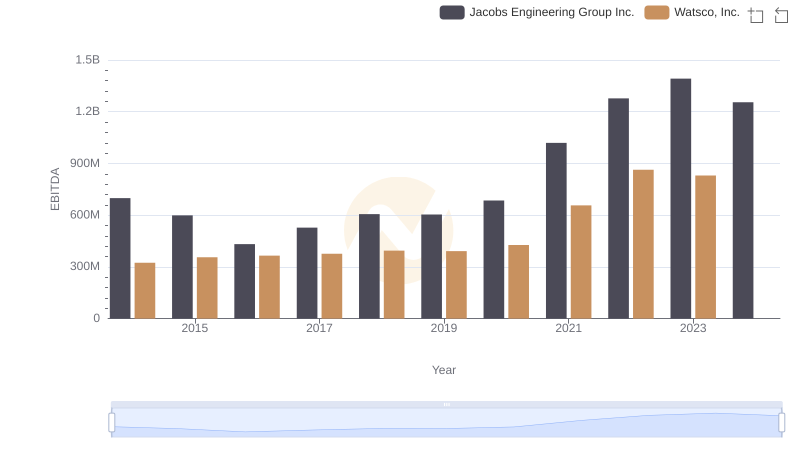
Professional EBITDA Benchmarking: Watsco, Inc. vs Jacobs Engineering Group Inc.