| __timestamp | Masco Corporation | Watsco, Inc. |
|---|---|---|
| Wednesday, January 1, 2014 | 2387000000 | 956402000 |
| Thursday, January 1, 2015 | 2253000000 | 1007357000 |
| Friday, January 1, 2016 | 2456000000 | 1034584000 |
| Sunday, January 1, 2017 | 2611000000 | 1065659000 |
| Monday, January 1, 2018 | 2689000000 | 1120252000 |
| Tuesday, January 1, 2019 | 2371000000 | 1156956000 |
| Wednesday, January 1, 2020 | 2587000000 | 1222821000 |
| Friday, January 1, 2021 | 2863000000 | 1667545000 |
| Saturday, January 1, 2022 | 2713000000 | 2030289000 |
| Sunday, January 1, 2023 | 2836000000 | 1992140000 |
| Monday, January 1, 2024 | 2831000000 | 2044713000 |
Cracking the code
In the competitive landscape of the building materials industry, Watsco, Inc. and Masco Corporation have showcased intriguing gross profit trends over the past decade. From 2014 to 2023, Masco Corporation consistently outperformed Watsco, Inc., with an average gross profit nearly double that of its competitor. Notably, Masco's gross profit peaked in 2021, reaching approximately 2.9 billion, marking a 27% increase from 2014. Meanwhile, Watsco, Inc. demonstrated a robust growth trajectory, with its gross profit more than doubling from 2014 to 2022, peaking at around 2 billion. This growth reflects Watsco's strategic market expansions and operational efficiencies. As of 2023, both companies have shown resilience amidst economic fluctuations, with Masco maintaining a steady lead. These trends highlight the dynamic nature of the industry and the strategic maneuvers of these corporate titans.
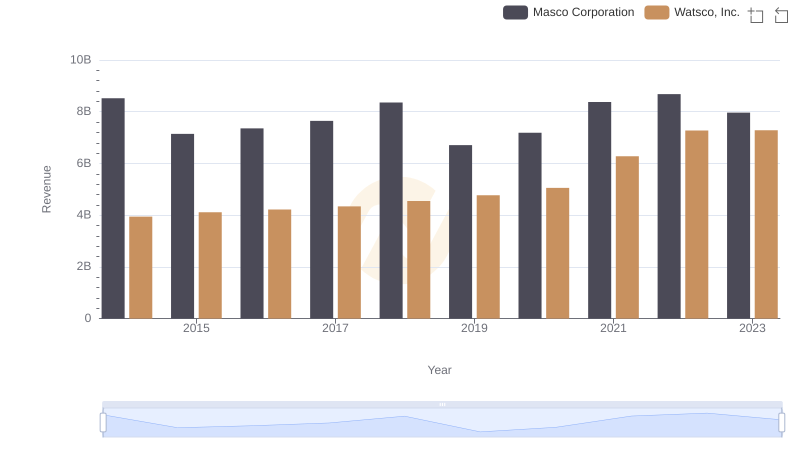
Revenue Insights: Watsco, Inc. and Masco Corporation Performance Compared
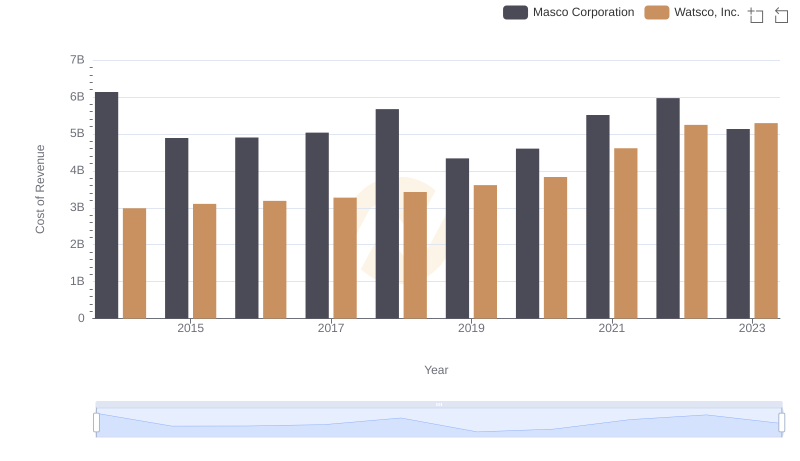
Watsco, Inc. vs Masco Corporation: Efficiency in Cost of Revenue Explored
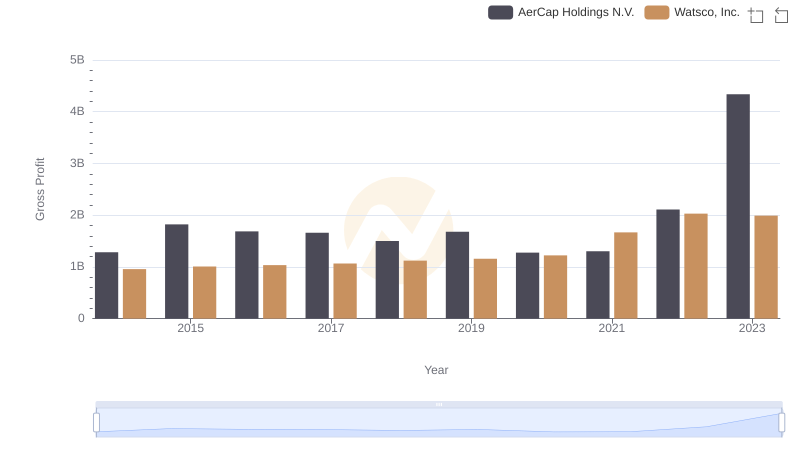
Gross Profit Comparison: Watsco, Inc. and AerCap Holdings N.V. Trends
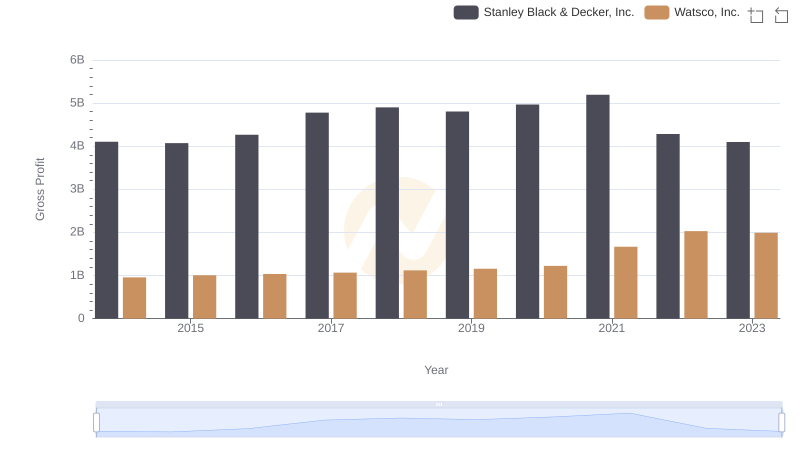
Key Insights on Gross Profit: Watsco, Inc. vs Stanley Black & Decker, Inc.
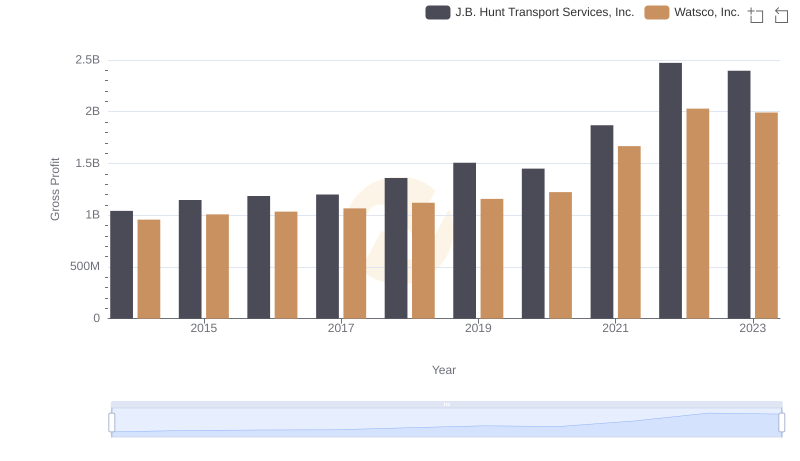
Key Insights on Gross Profit: Watsco, Inc. vs J.B. Hunt Transport Services, Inc.
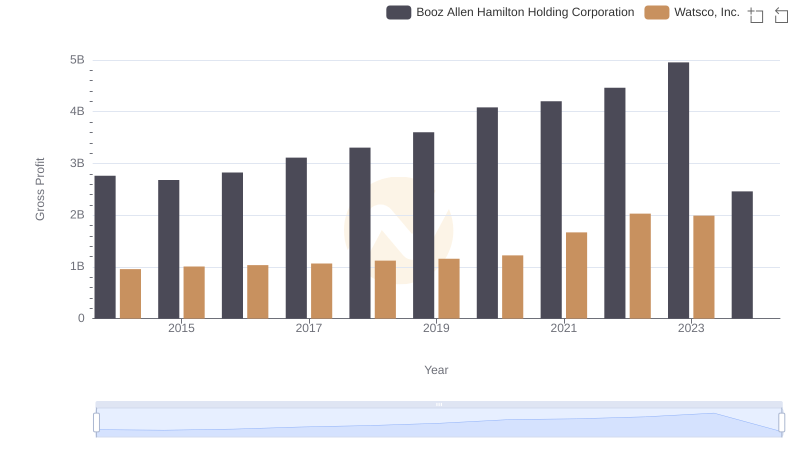
Who Generates Higher Gross Profit? Watsco, Inc. or Booz Allen Hamilton Holding Corporation
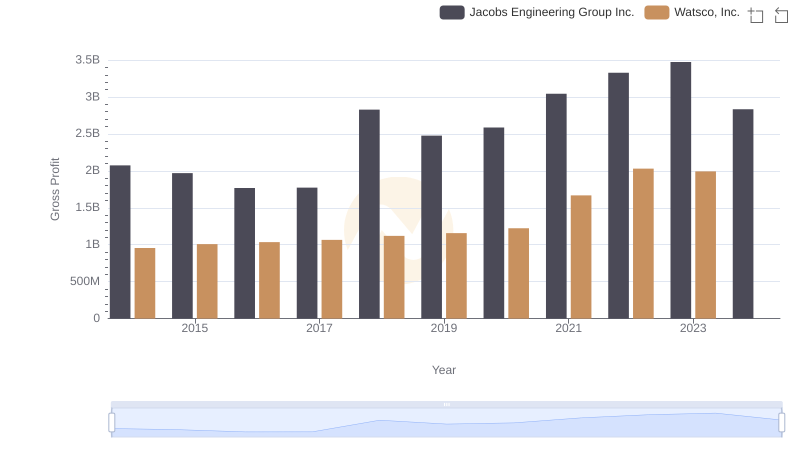
Key Insights on Gross Profit: Watsco, Inc. vs Jacobs Engineering Group Inc.
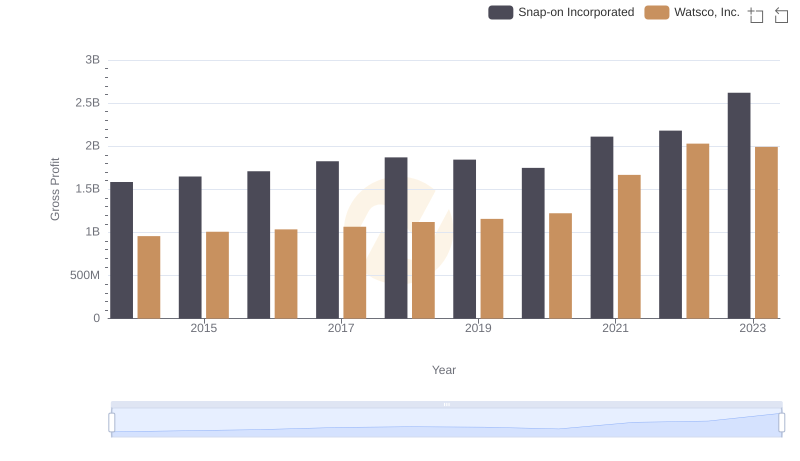
Gross Profit Comparison: Watsco, Inc. and Snap-on Incorporated Trends
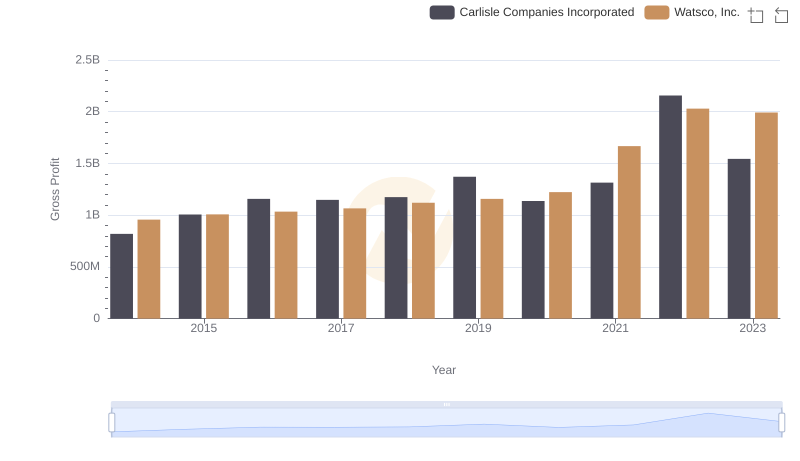
Key Insights on Gross Profit: Watsco, Inc. vs Carlisle Companies Incorporated
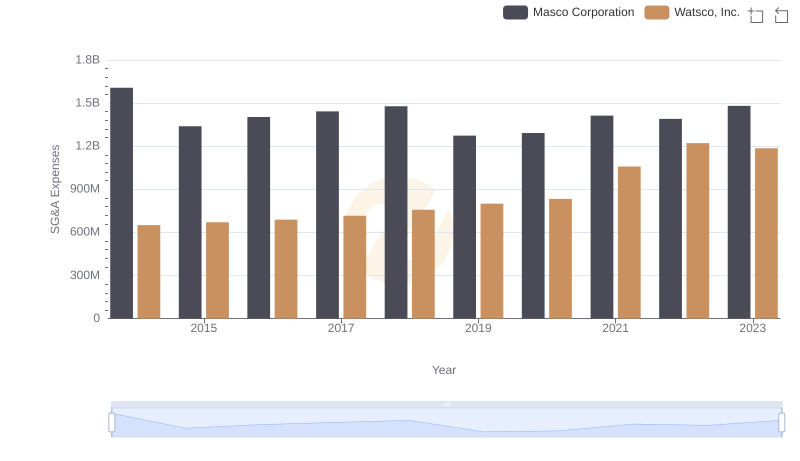
SG&A Efficiency Analysis: Comparing Watsco, Inc. and Masco Corporation
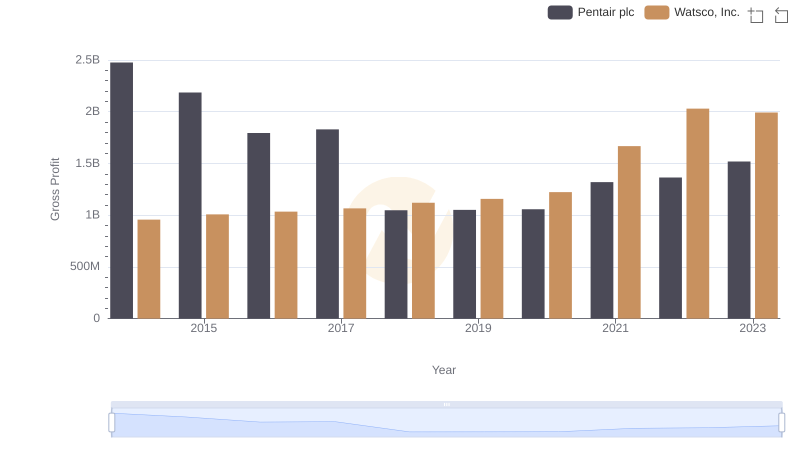
Gross Profit Comparison: Watsco, Inc. and Pentair plc Trends
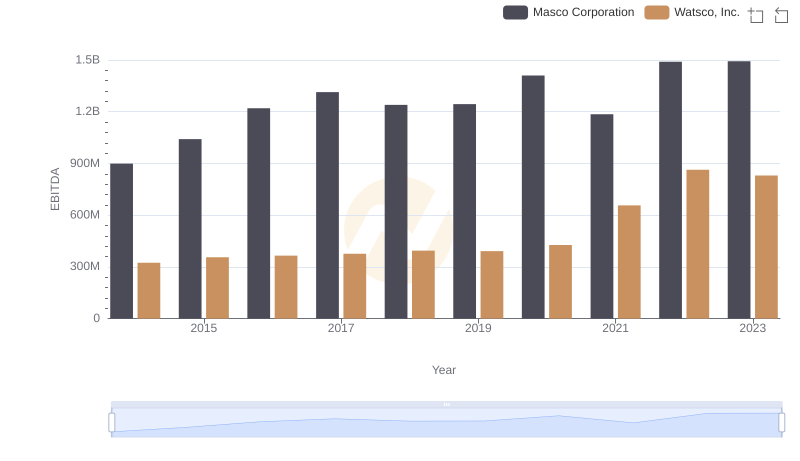
Comparative EBITDA Analysis: Watsco, Inc. vs Masco Corporation