| __timestamp | Carlisle Companies Incorporated | Watsco, Inc. |
|---|---|---|
| Wednesday, January 1, 2014 | 2384500000 | 2988138000 |
| Thursday, January 1, 2015 | 2536500000 | 3105882000 |
| Friday, January 1, 2016 | 2518100000 | 3186118000 |
| Sunday, January 1, 2017 | 2941900000 | 3276296000 |
| Monday, January 1, 2018 | 3304800000 | 3426401000 |
| Tuesday, January 1, 2019 | 3439900000 | 3613406000 |
| Wednesday, January 1, 2020 | 2832500000 | 3832107000 |
| Friday, January 1, 2021 | 3495600000 | 4612647000 |
| Saturday, January 1, 2022 | 4434500000 | 5244055000 |
| Sunday, January 1, 2023 | 3042900000 | 5291627000 |
| Monday, January 1, 2024 | 3115900000 | 5573604000 |
Unleashing insights
In the ever-evolving landscape of industrial giants, understanding cost structures is pivotal. Watsco, Inc. and Carlisle Companies Incorporated, two stalwarts in their respective fields, have shown intriguing trends in their cost of revenue over the past decade. From 2014 to 2023, Watsco's cost of revenue surged by approximately 77%, peaking in 2023. In contrast, Carlisle Companies experienced a more modest increase of around 28% during the same period, with a notable dip in 2020. This divergence highlights Watsco's aggressive growth strategy, while Carlisle's fluctuations suggest a more conservative approach. The data reveals that Watsco consistently outpaces Carlisle in cost of revenue, underscoring its expansive operational scale. As we delve deeper into these financial narratives, the insights gleaned offer a window into the strategic priorities and market dynamics shaping these industry leaders.
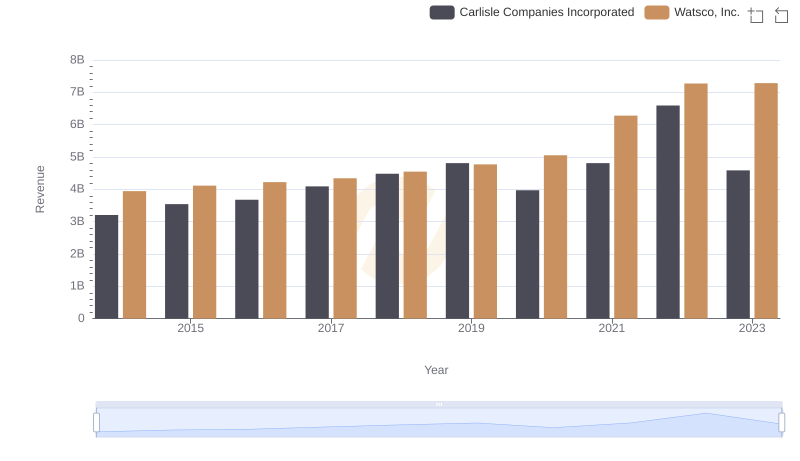
Annual Revenue Comparison: Watsco, Inc. vs Carlisle Companies Incorporated
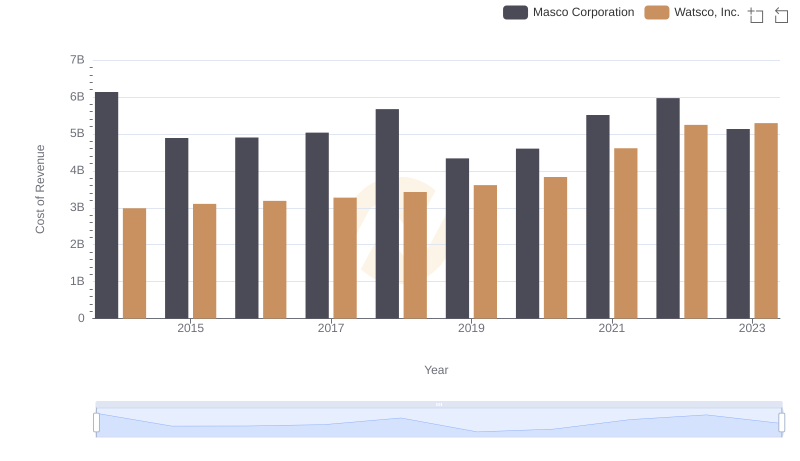
Watsco, Inc. vs Masco Corporation: Efficiency in Cost of Revenue Explored
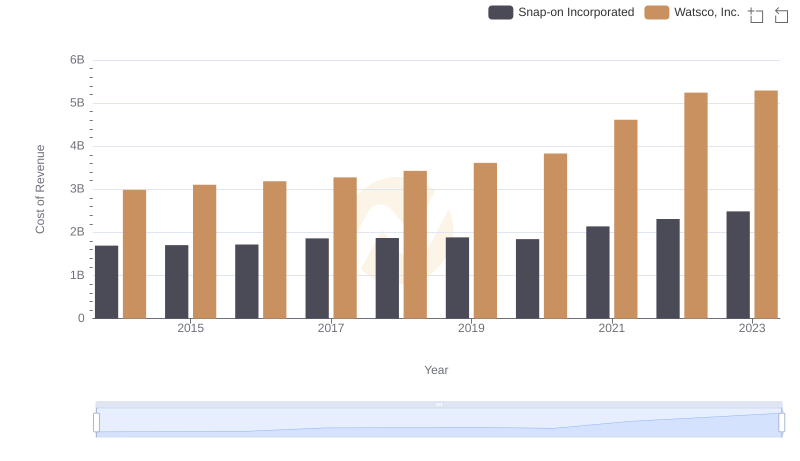
Cost Insights: Breaking Down Watsco, Inc. and Snap-on Incorporated's Expenses
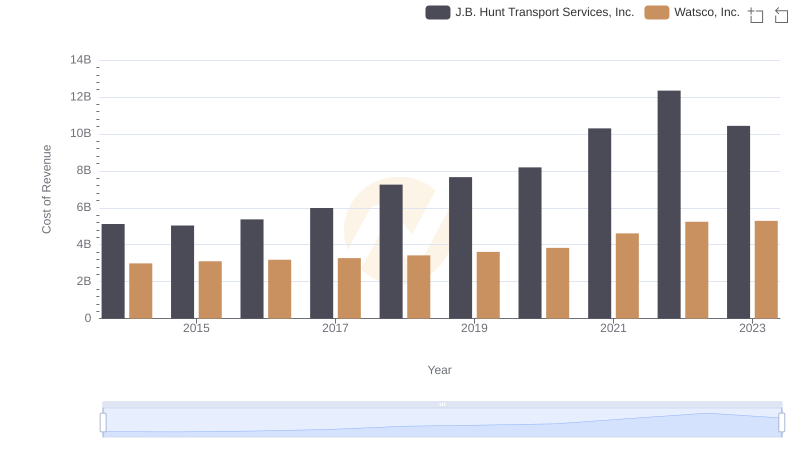
Cost Insights: Breaking Down Watsco, Inc. and J.B. Hunt Transport Services, Inc.'s Expenses
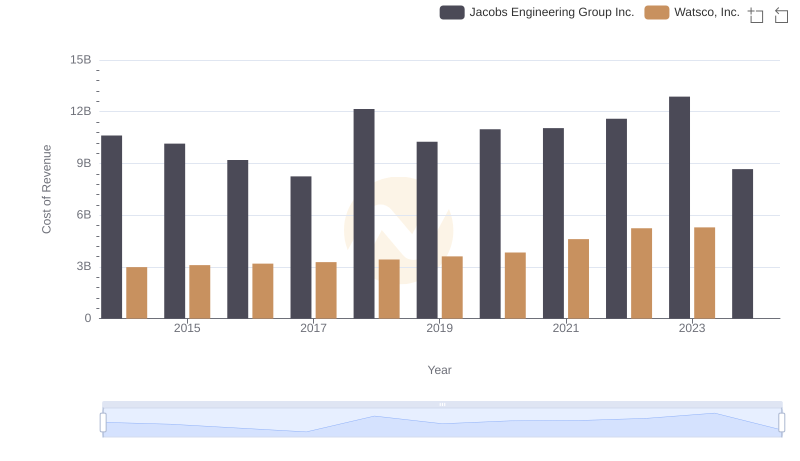
Cost of Revenue: Key Insights for Watsco, Inc. and Jacobs Engineering Group Inc.
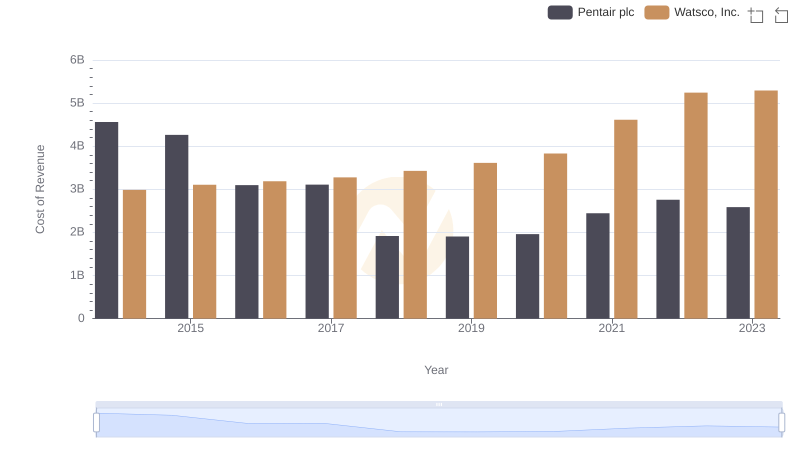
Cost of Revenue Trends: Watsco, Inc. vs Pentair plc
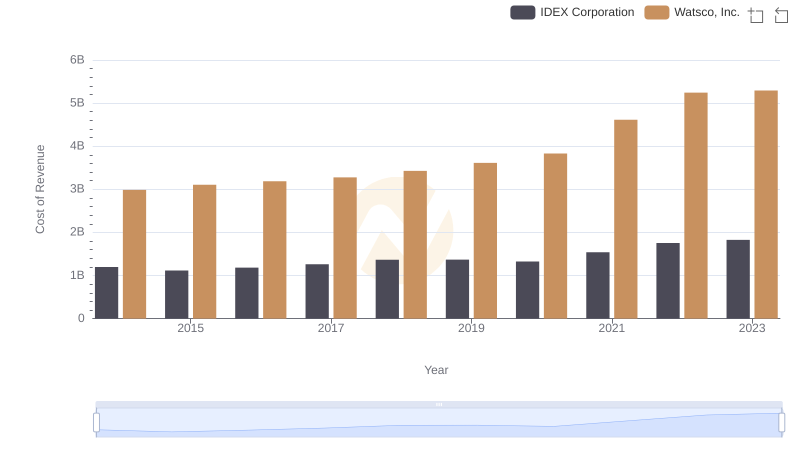
Cost Insights: Breaking Down Watsco, Inc. and IDEX Corporation's Expenses
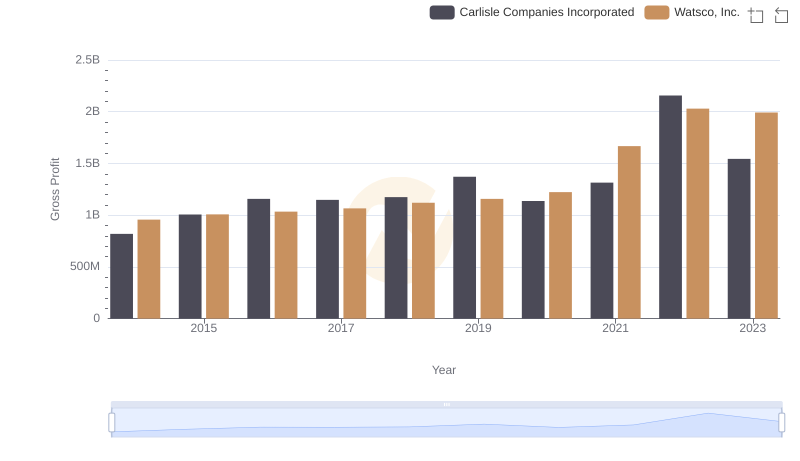
Key Insights on Gross Profit: Watsco, Inc. vs Carlisle Companies Incorporated
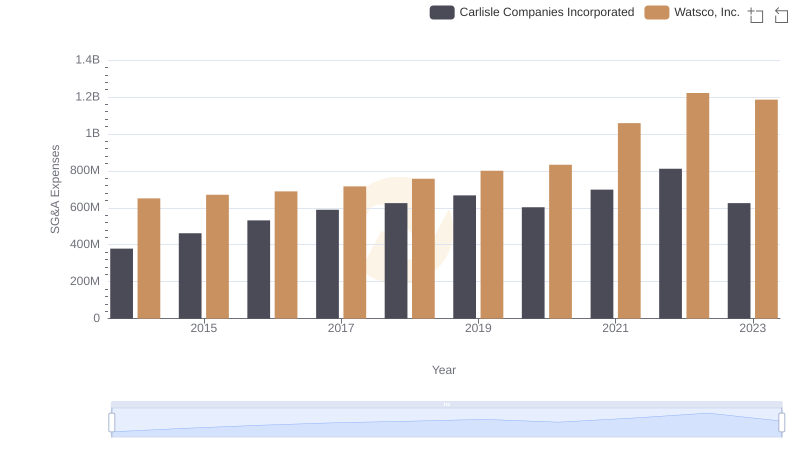
Watsco, Inc. and Carlisle Companies Incorporated: SG&A Spending Patterns Compared
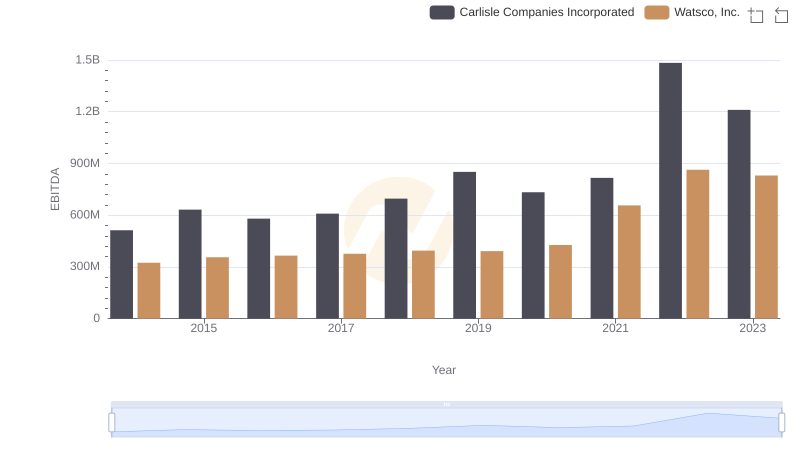
Watsco, Inc. and Carlisle Companies Incorporated: A Detailed Examination of EBITDA Performance