| __timestamp | Masco Corporation | Watsco, Inc. |
|---|---|---|
| Wednesday, January 1, 2014 | 1607000000 | 650655000 |
| Thursday, January 1, 2015 | 1339000000 | 670609000 |
| Friday, January 1, 2016 | 1403000000 | 688952000 |
| Sunday, January 1, 2017 | 1442000000 | 715671000 |
| Monday, January 1, 2018 | 1478000000 | 757452000 |
| Tuesday, January 1, 2019 | 1274000000 | 800328000 |
| Wednesday, January 1, 2020 | 1292000000 | 833051000 |
| Friday, January 1, 2021 | 1413000000 | 1058316000 |
| Saturday, January 1, 2022 | 1390000000 | 1221382000 |
| Sunday, January 1, 2023 | 1481000000 | 1185626000 |
| Monday, January 1, 2024 | 1468000000 | 1262938000 |
Data in motion
In the competitive landscape of the U.S. stock market, understanding a company's operational efficiency is crucial. Selling, General, and Administrative (SG&A) expenses are a key indicator of this efficiency. Over the past decade, Watsco, Inc. and Masco Corporation have shown contrasting trends in their SG&A expenses.
From 2014 to 2023, Masco Corporation's SG&A expenses fluctuated, peaking in 2014 and 2023, with a notable dip in 2019. This reflects a strategic shift, possibly towards cost optimization. Meanwhile, Watsco, Inc. demonstrated a steady increase, with a significant 88% rise from 2014 to 2023, indicating expansion and investment in operational capabilities.
These trends highlight differing strategic priorities: Masco's focus on cost control versus Watsco's growth-driven approach. Investors and analysts should consider these dynamics when evaluating the long-term potential of these companies.
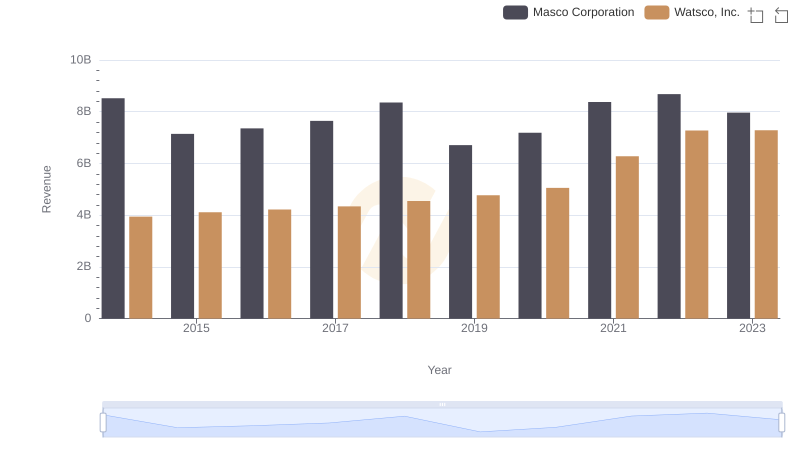
Revenue Insights: Watsco, Inc. and Masco Corporation Performance Compared
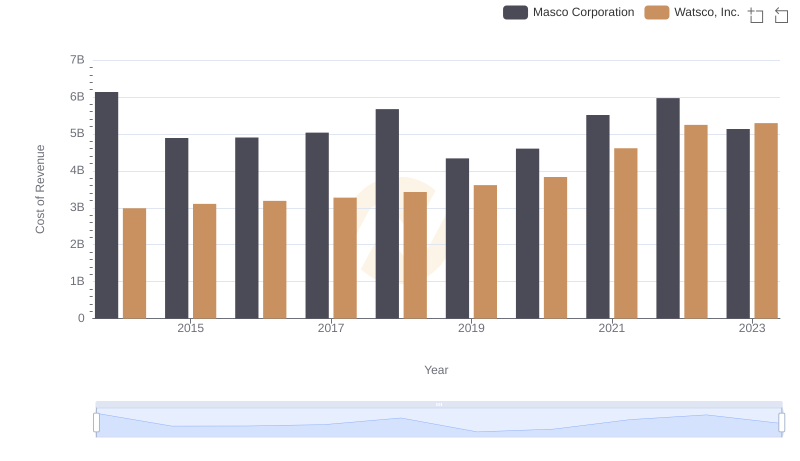
Watsco, Inc. vs Masco Corporation: Efficiency in Cost of Revenue Explored
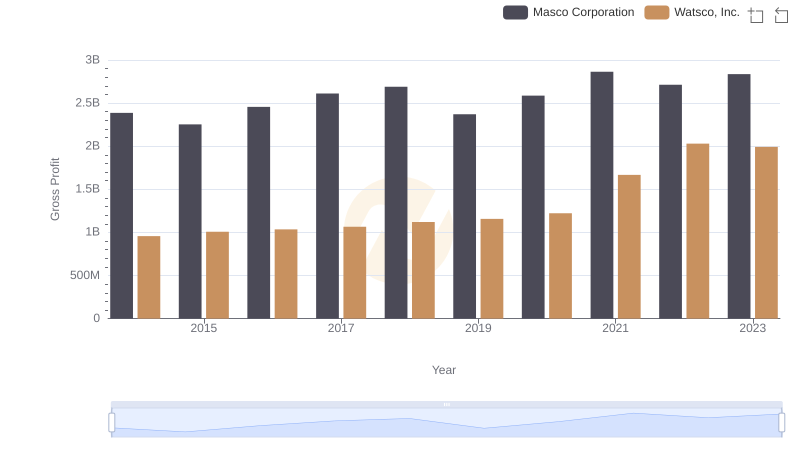
Gross Profit Trends Compared: Watsco, Inc. vs Masco Corporation
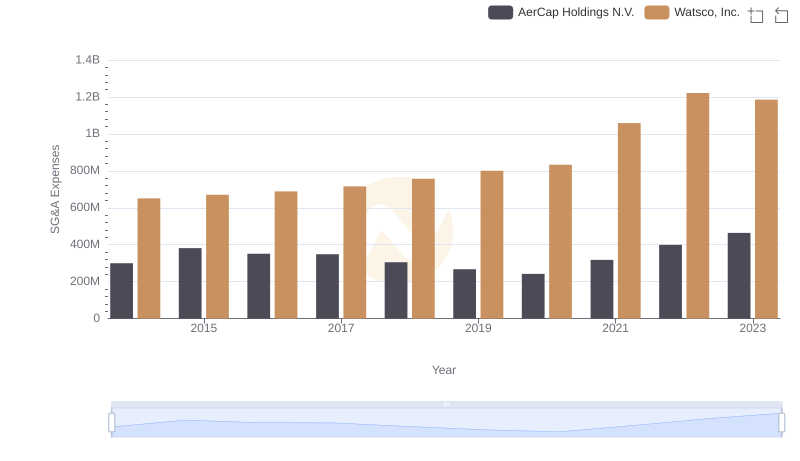
Breaking Down SG&A Expenses: Watsco, Inc. vs AerCap Holdings N.V.
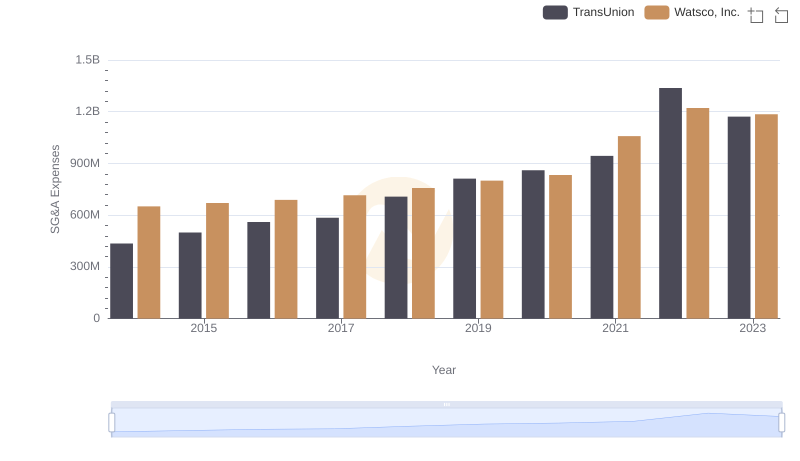
Breaking Down SG&A Expenses: Watsco, Inc. vs TransUnion
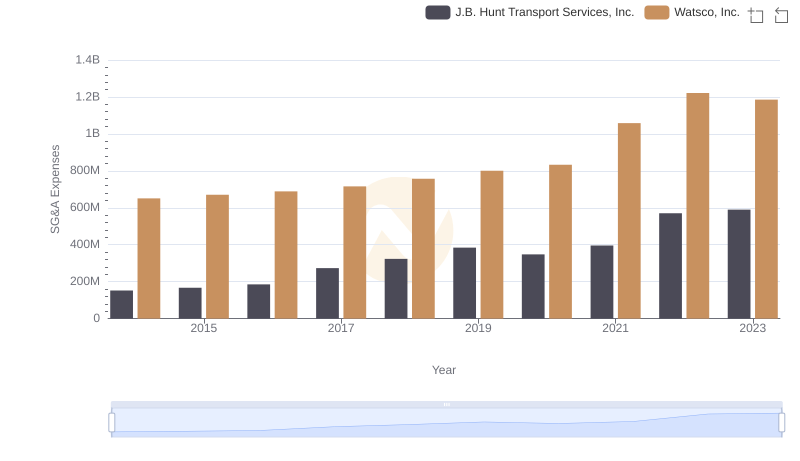
Operational Costs Compared: SG&A Analysis of Watsco, Inc. and J.B. Hunt Transport Services, Inc.
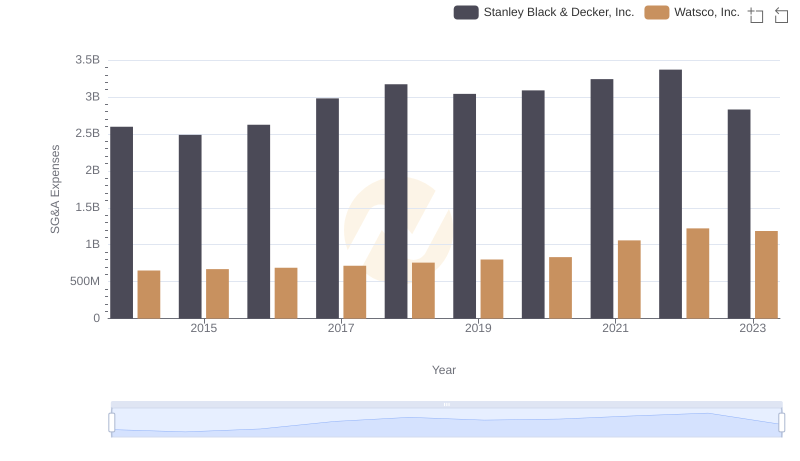
Breaking Down SG&A Expenses: Watsco, Inc. vs Stanley Black & Decker, Inc.
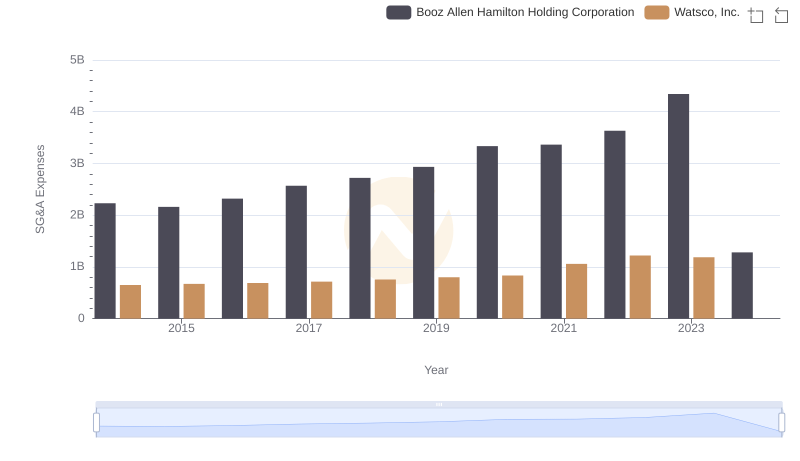
Comparing SG&A Expenses: Watsco, Inc. vs Booz Allen Hamilton Holding Corporation Trends and Insights
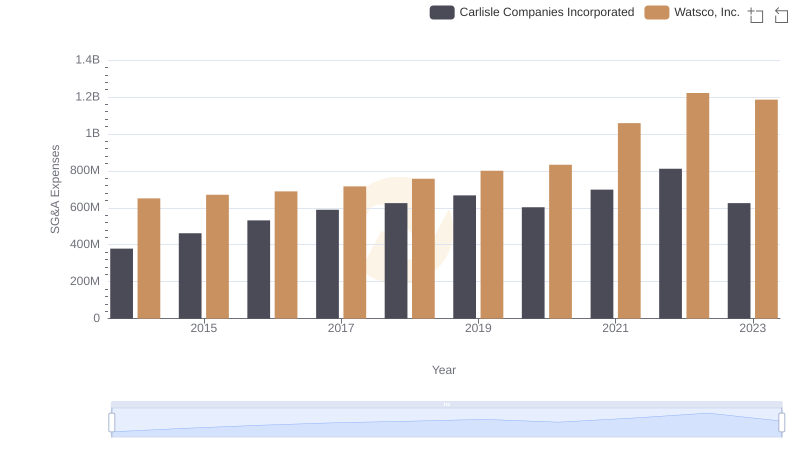
Watsco, Inc. and Carlisle Companies Incorporated: SG&A Spending Patterns Compared
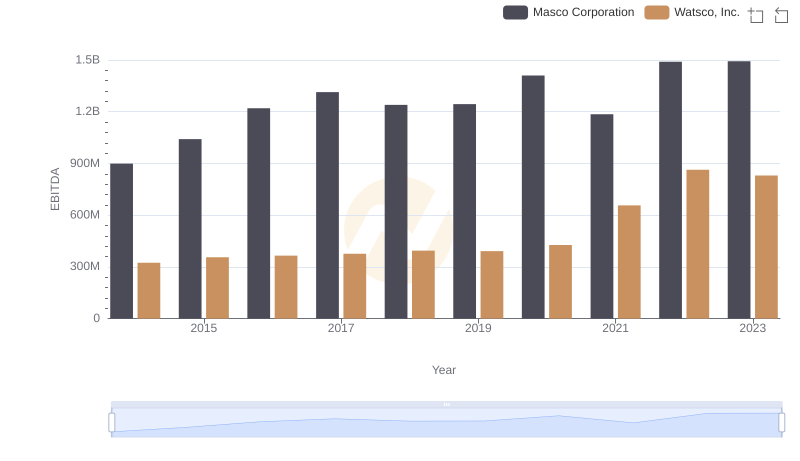
Comparative EBITDA Analysis: Watsco, Inc. vs Masco Corporation