| __timestamp | Masco Corporation | Watsco, Inc. |
|---|---|---|
| Wednesday, January 1, 2014 | 899000000 | 323674000 |
| Thursday, January 1, 2015 | 1041000000 | 355865000 |
| Friday, January 1, 2016 | 1220000000 | 365698000 |
| Sunday, January 1, 2017 | 1314000000 | 375907000 |
| Monday, January 1, 2018 | 1240000000 | 394177000 |
| Tuesday, January 1, 2019 | 1244000000 | 391396000 |
| Wednesday, January 1, 2020 | 1410000000 | 426942000 |
| Friday, January 1, 2021 | 1185000000 | 656655000 |
| Saturday, January 1, 2022 | 1490000000 | 863261000 |
| Sunday, January 1, 2023 | 1493000000 | 829900000 |
| Monday, January 1, 2024 | 1410000000 | 781775000 |
Unleashing the power of data
In the ever-evolving landscape of the HVAC and home improvement industries, Watsco, Inc. and Masco Corporation have emerged as formidable players. Over the past decade, from 2014 to 2023, these companies have demonstrated remarkable EBITDA growth, reflecting their strategic prowess and market adaptability.
Masco Corporation, a leader in home improvement and building products, has seen its EBITDA grow by approximately 66% over this period. Starting at 899 million in 2014, it reached a peak of 1.493 billion in 2023, showcasing a consistent upward trajectory.
Watsco, Inc., a major distributor of HVAC products, has experienced an even more impressive growth rate of around 156%. From 324 million in 2014, its EBITDA surged to 863 million in 2022, before slightly dipping to 830 million in 2023.
This comparative analysis highlights the dynamic growth strategies of both companies, with Watsco's rapid ascent and Masco's steady climb offering valuable insights into their respective market strategies and operational efficiencies.
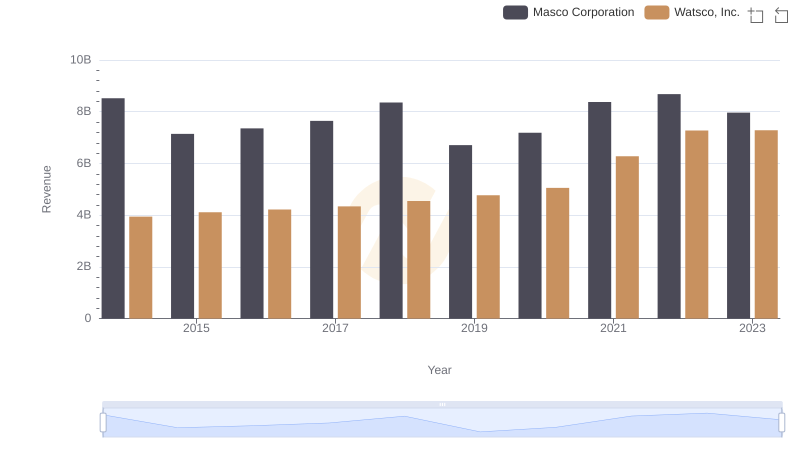
Revenue Insights: Watsco, Inc. and Masco Corporation Performance Compared
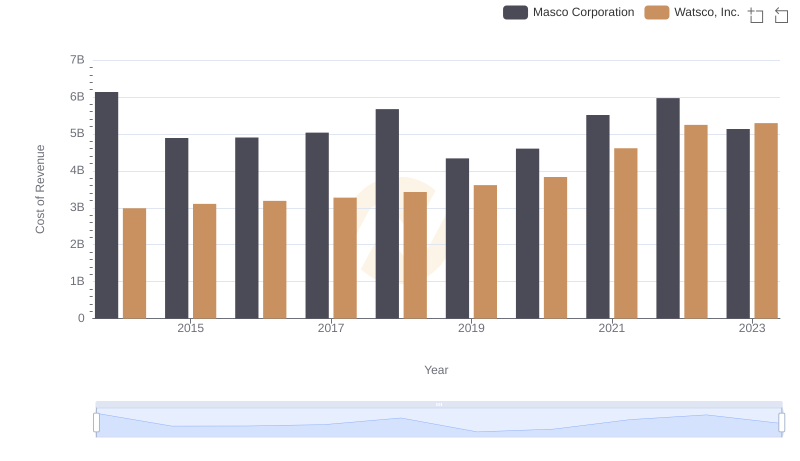
Watsco, Inc. vs Masco Corporation: Efficiency in Cost of Revenue Explored
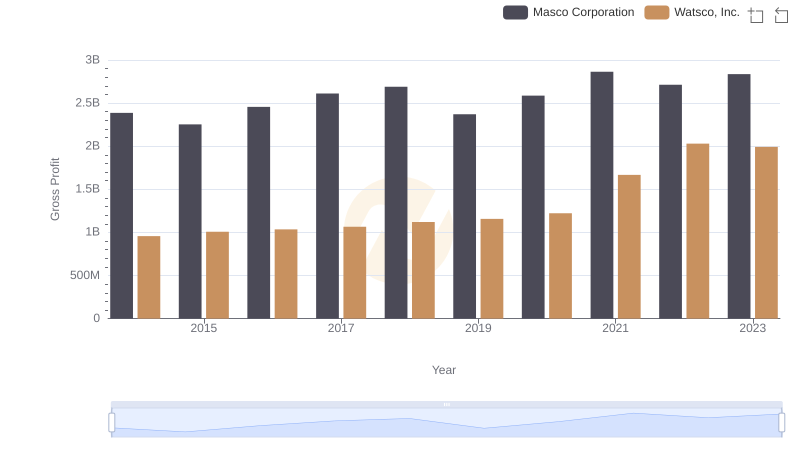
Gross Profit Trends Compared: Watsco, Inc. vs Masco Corporation
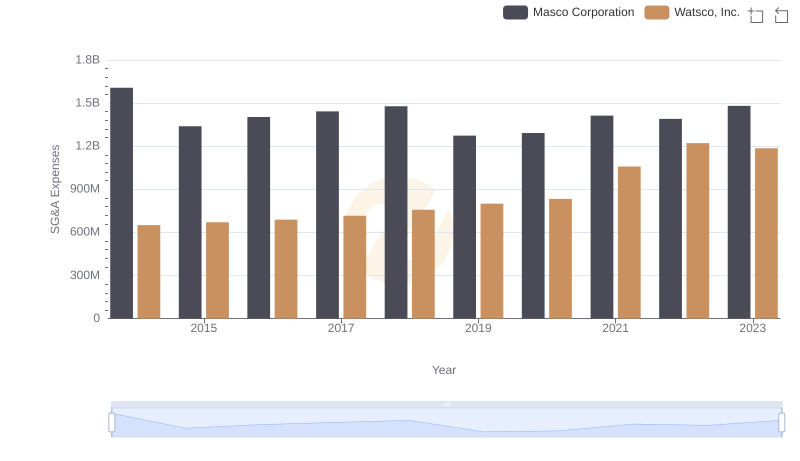
SG&A Efficiency Analysis: Comparing Watsco, Inc. and Masco Corporation
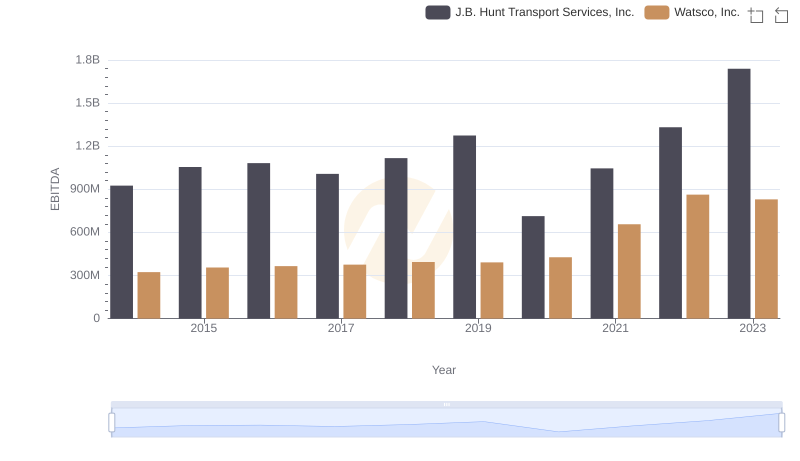
A Professional Review of EBITDA: Watsco, Inc. Compared to J.B. Hunt Transport Services, Inc.
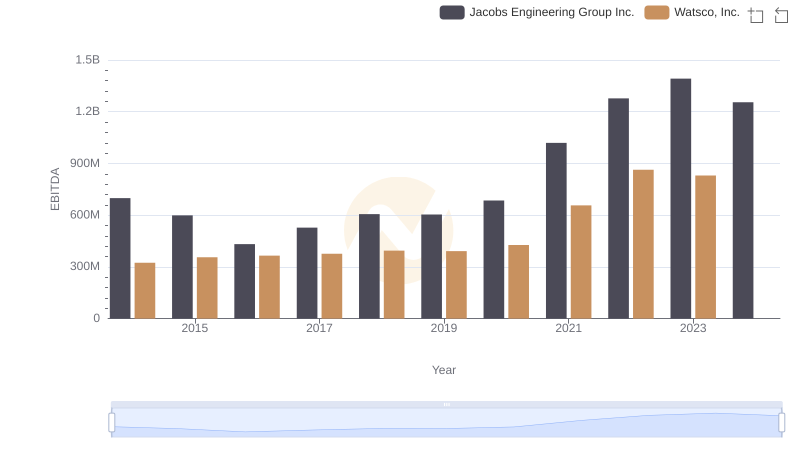
Professional EBITDA Benchmarking: Watsco, Inc. vs Jacobs Engineering Group Inc.
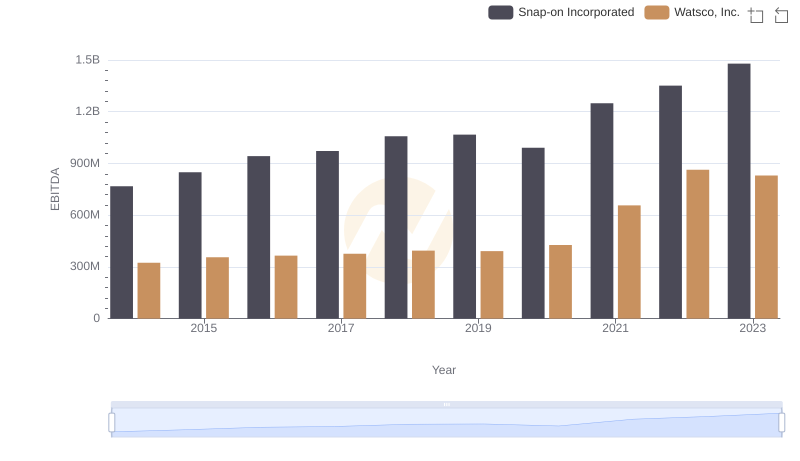
Comparative EBITDA Analysis: Watsco, Inc. vs Snap-on Incorporated
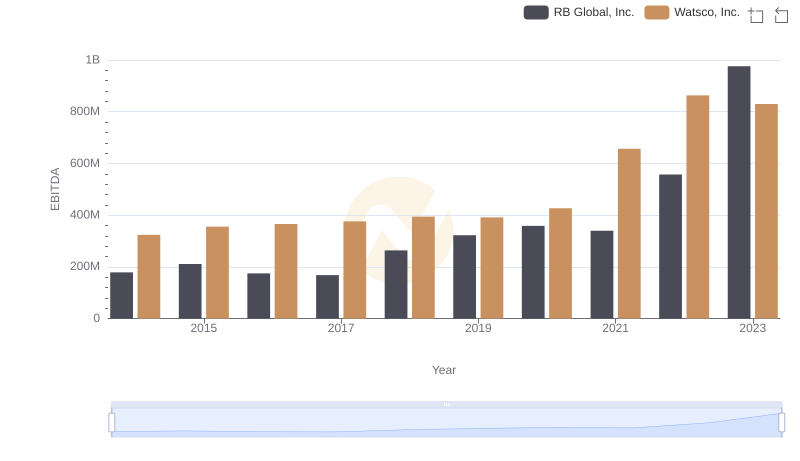
Comprehensive EBITDA Comparison: Watsco, Inc. vs RB Global, Inc.