| __timestamp | Masco Corporation | Watsco, Inc. |
|---|---|---|
| Wednesday, January 1, 2014 | 8521000000 | 3944540000 |
| Thursday, January 1, 2015 | 7142000000 | 4113239000 |
| Friday, January 1, 2016 | 7357000000 | 4220702000 |
| Sunday, January 1, 2017 | 7644000000 | 4341955000 |
| Monday, January 1, 2018 | 8359000000 | 4546653000 |
| Tuesday, January 1, 2019 | 6707000000 | 4770362000 |
| Wednesday, January 1, 2020 | 7188000000 | 5054928000 |
| Friday, January 1, 2021 | 8375000000 | 6280192000 |
| Saturday, January 1, 2022 | 8680000000 | 7274344000 |
| Sunday, January 1, 2023 | 7967000000 | 7283767000 |
| Monday, January 1, 2024 | 7828000000 | 7618317000 |
Igniting the spark of knowledge
In the ever-evolving landscape of the HVAC and home improvement sectors, Watsco, Inc. and Masco Corporation have emerged as key players. Over the past decade, these companies have demonstrated distinct revenue trajectories. From 2014 to 2023, Masco Corporation's revenue fluctuated, peaking in 2022 with an impressive 12% increase from 2019, before experiencing a slight dip in 2023. Meanwhile, Watsco, Inc. showcased a robust growth pattern, with revenue surging by approximately 85% over the same period, reaching its zenith in 2023. This growth underscores Watsco's strategic market positioning and resilience amidst economic challenges. As the industry continues to adapt to changing consumer demands and technological advancements, these insights provide a valuable lens into the financial health and strategic direction of these industry giants.
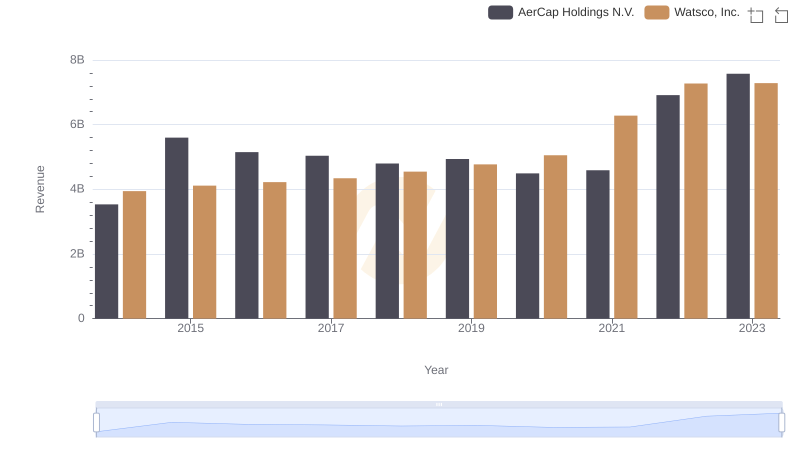
Watsco, Inc. vs AerCap Holdings N.V.: Examining Key Revenue Metrics
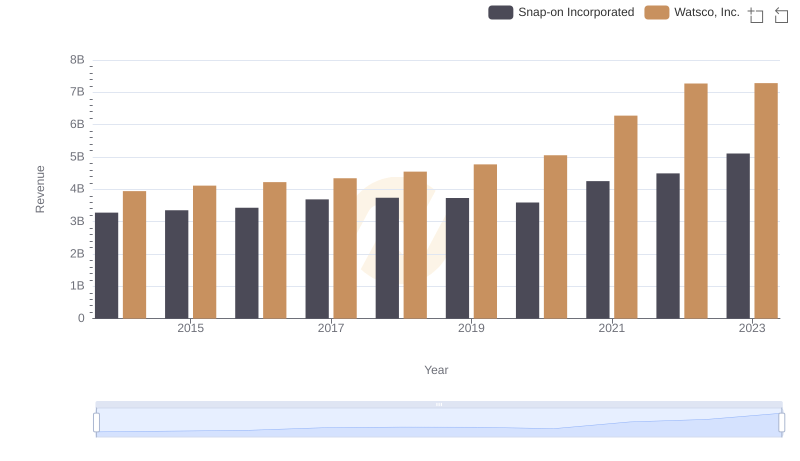
Watsco, Inc. and Snap-on Incorporated: A Comprehensive Revenue Analysis
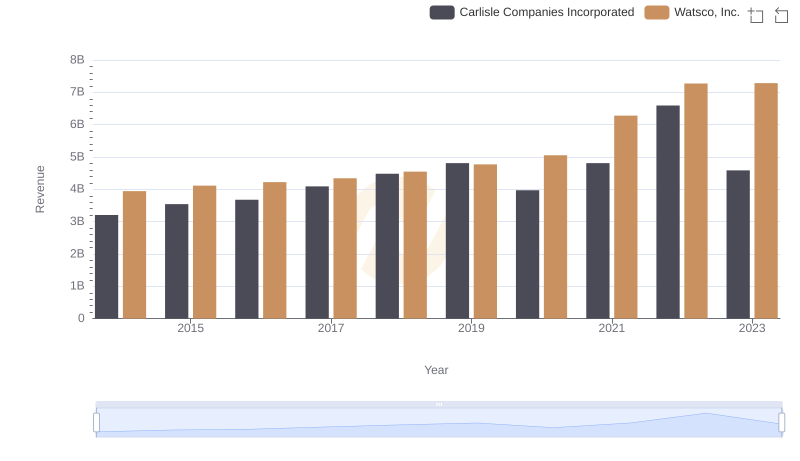
Annual Revenue Comparison: Watsco, Inc. vs Carlisle Companies Incorporated
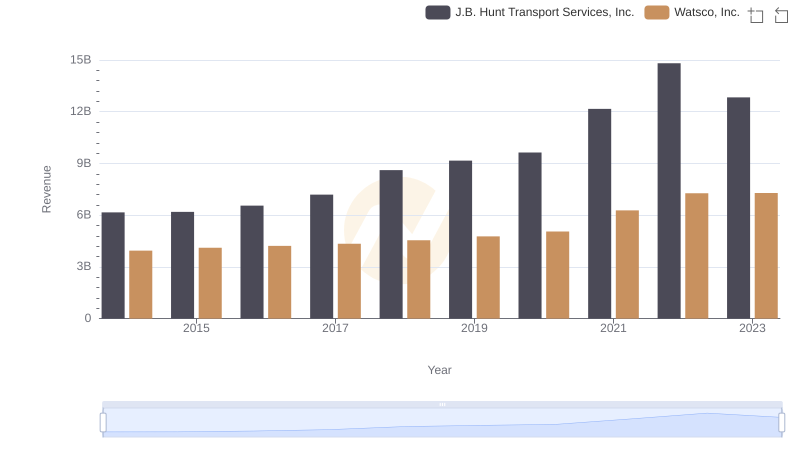
Watsco, Inc. vs J.B. Hunt Transport Services, Inc.: Annual Revenue Growth Compared
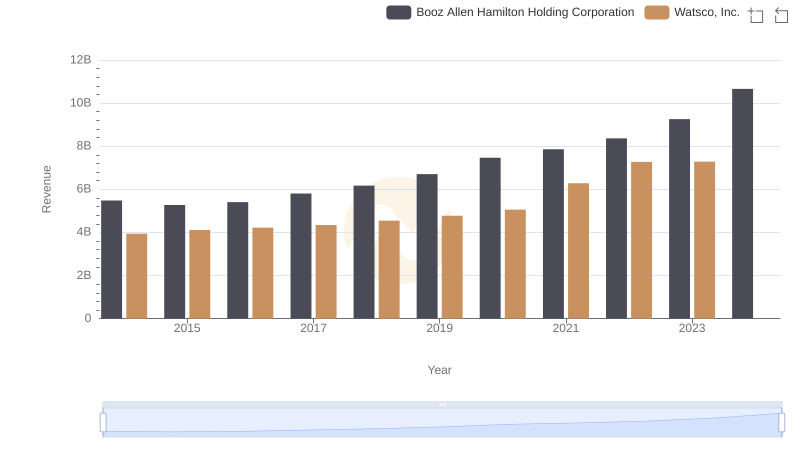
Watsco, Inc. vs Booz Allen Hamilton Holding Corporation: Annual Revenue Growth Compared
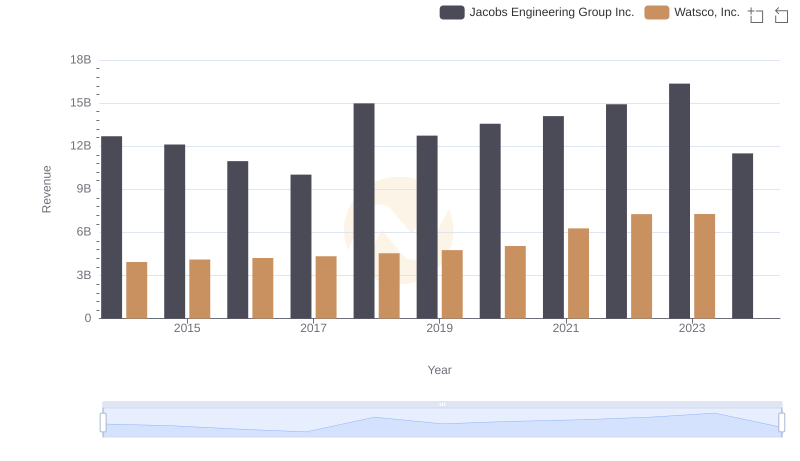
Breaking Down Revenue Trends: Watsco, Inc. vs Jacobs Engineering Group Inc.
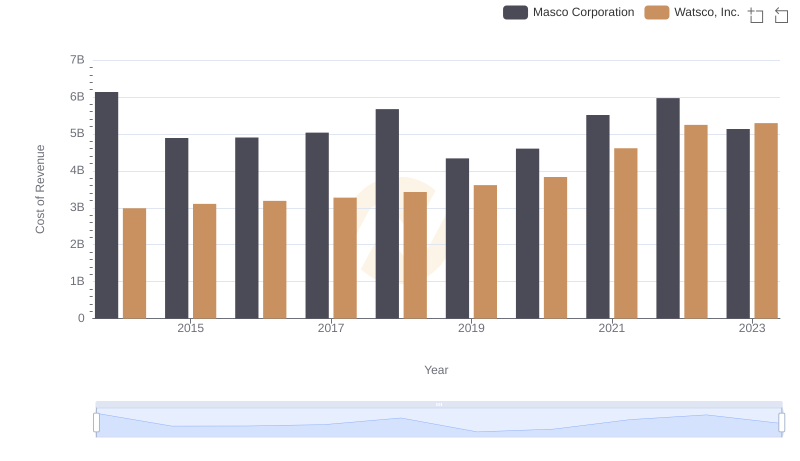
Watsco, Inc. vs Masco Corporation: Efficiency in Cost of Revenue Explored
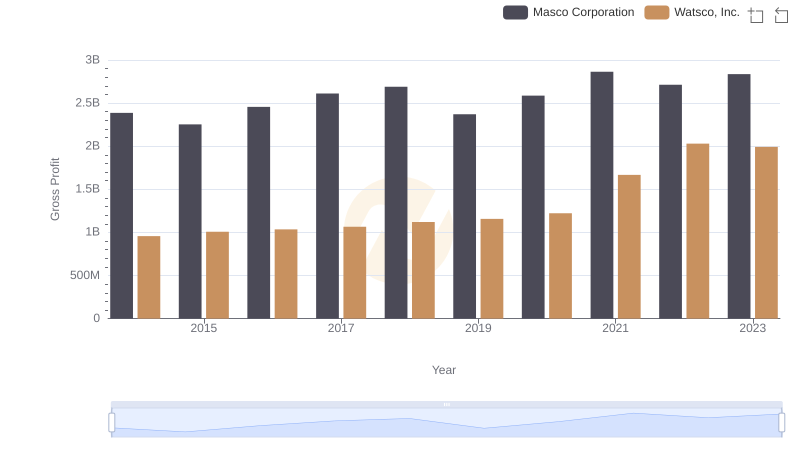
Gross Profit Trends Compared: Watsco, Inc. vs Masco Corporation
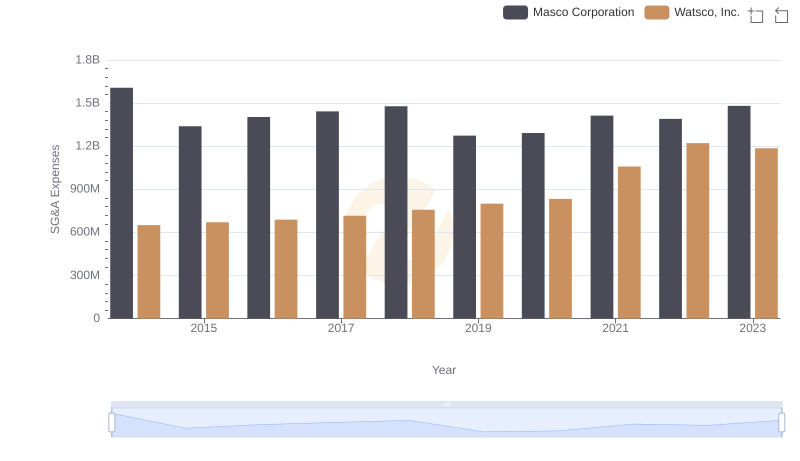
SG&A Efficiency Analysis: Comparing Watsco, Inc. and Masco Corporation
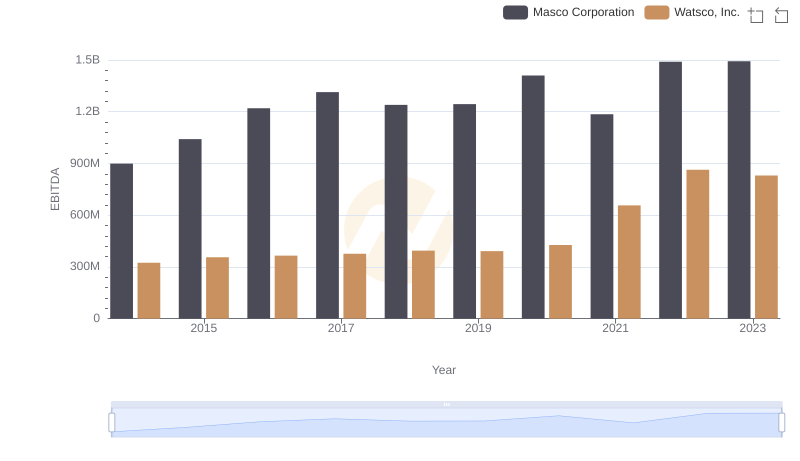
Comparative EBITDA Analysis: Watsco, Inc. vs Masco Corporation