| __timestamp | J.B. Hunt Transport Services, Inc. | Watsco, Inc. |
|---|---|---|
| Wednesday, January 1, 2014 | 5124095000 | 2988138000 |
| Thursday, January 1, 2015 | 5041472000 | 3105882000 |
| Friday, January 1, 2016 | 5369826000 | 3186118000 |
| Sunday, January 1, 2017 | 5990275000 | 3276296000 |
| Monday, January 1, 2018 | 7255657000 | 3426401000 |
| Tuesday, January 1, 2019 | 7659003000 | 3613406000 |
| Wednesday, January 1, 2020 | 8186697000 | 3832107000 |
| Friday, January 1, 2021 | 10298483000 | 4612647000 |
| Saturday, January 1, 2022 | 12341472000 | 5244055000 |
| Sunday, January 1, 2023 | 10433277000 | 5291627000 |
| Monday, January 1, 2024 | 5573604000 |
Unleashing insights
In the ever-evolving landscape of American business, understanding cost structures is pivotal. Over the past decade, Watsco, Inc. and J.B. Hunt Transport Services, Inc. have demonstrated intriguing trends in their cost of revenue. From 2014 to 2023, J.B. Hunt's cost of revenue surged by approximately 103%, reflecting its strategic expansion and operational scaling. Meanwhile, Watsco, Inc. experienced a 77% increase, showcasing its steady growth in the HVAC distribution sector.
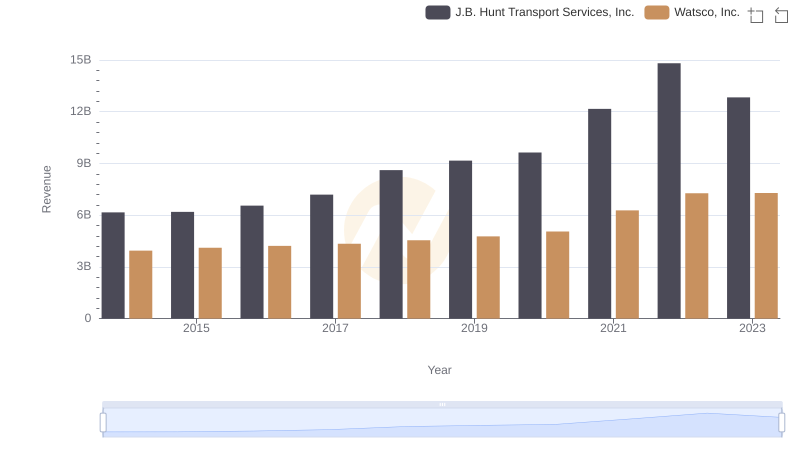
Watsco, Inc. vs J.B. Hunt Transport Services, Inc.: Annual Revenue Growth Compared
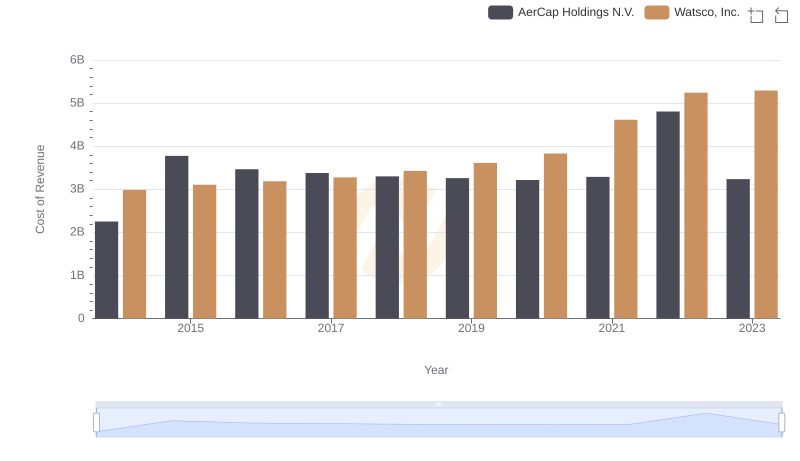
Cost of Revenue Comparison: Watsco, Inc. vs AerCap Holdings N.V.
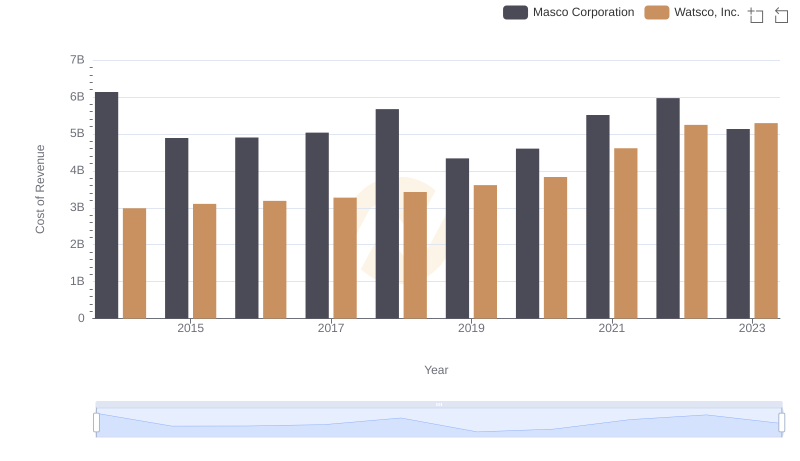
Watsco, Inc. vs Masco Corporation: Efficiency in Cost of Revenue Explored
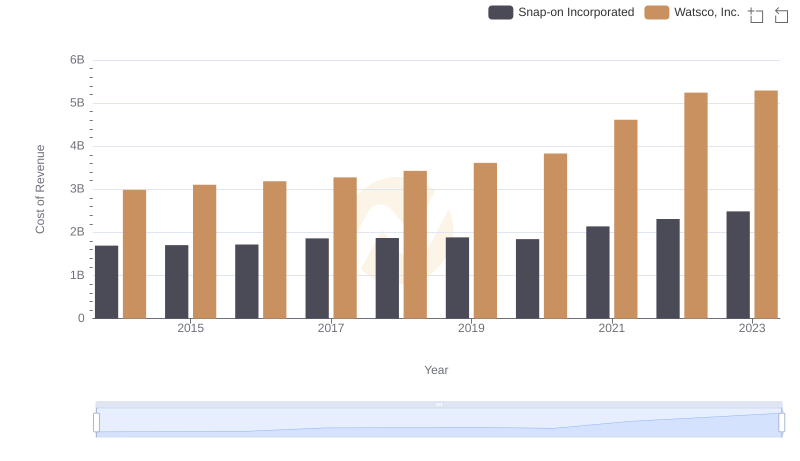
Cost Insights: Breaking Down Watsco, Inc. and Snap-on Incorporated's Expenses
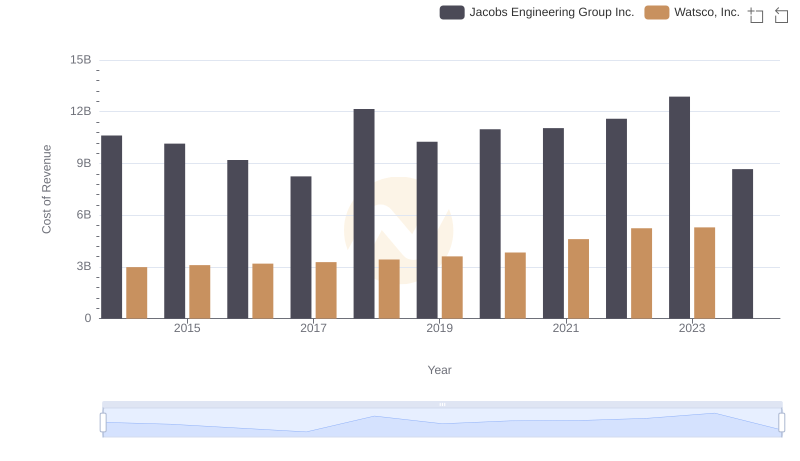
Cost of Revenue: Key Insights for Watsco, Inc. and Jacobs Engineering Group Inc.
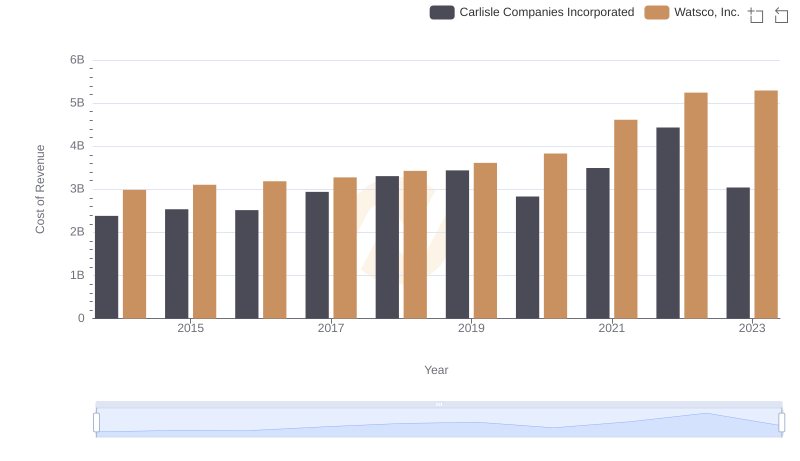
Cost Insights: Breaking Down Watsco, Inc. and Carlisle Companies Incorporated's Expenses
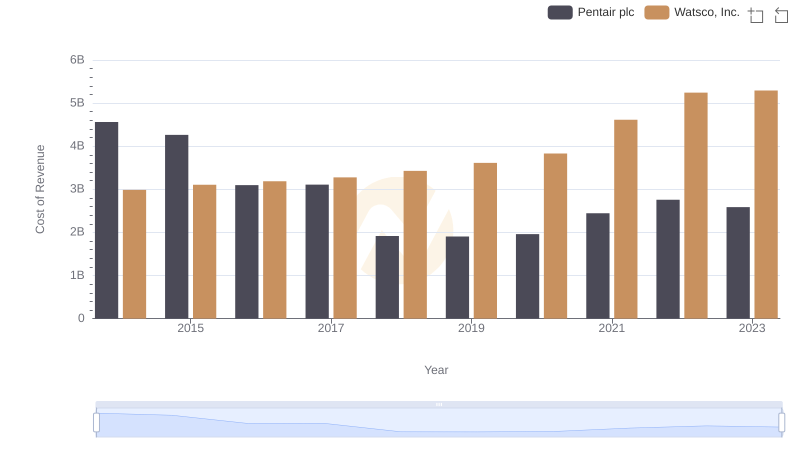
Cost of Revenue Trends: Watsco, Inc. vs Pentair plc
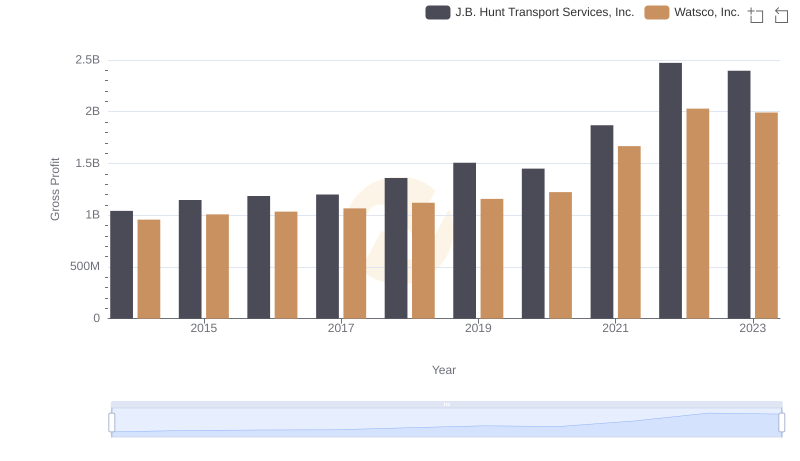
Key Insights on Gross Profit: Watsco, Inc. vs J.B. Hunt Transport Services, Inc.
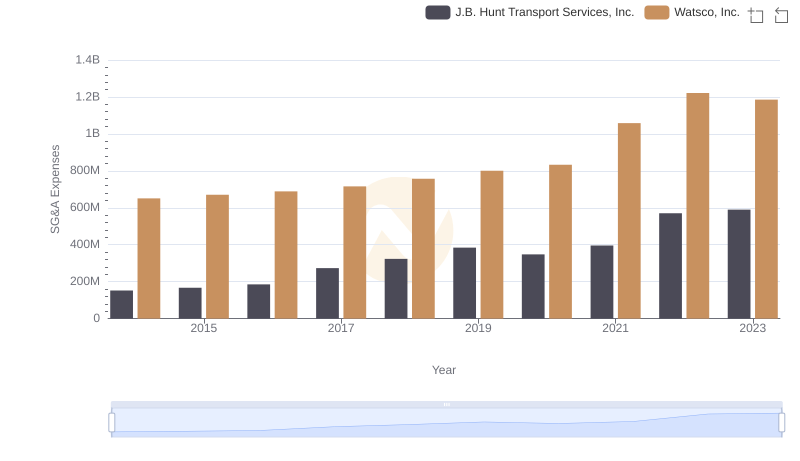
Operational Costs Compared: SG&A Analysis of Watsco, Inc. and J.B. Hunt Transport Services, Inc.
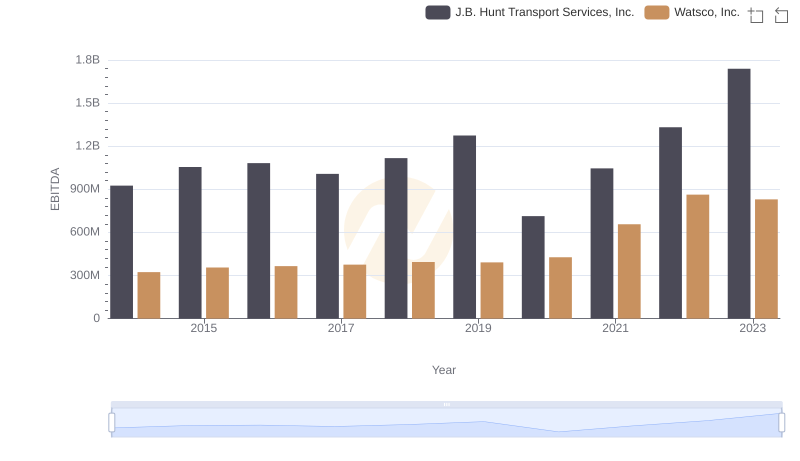
A Professional Review of EBITDA: Watsco, Inc. Compared to J.B. Hunt Transport Services, Inc.