| __timestamp | AerCap Holdings N.V. | Watsco, Inc. |
|---|---|---|
| Wednesday, January 1, 2014 | 2252878000 | 2988138000 |
| Thursday, January 1, 2015 | 3776407000 | 3105882000 |
| Friday, January 1, 2016 | 3465727000 | 3186118000 |
| Sunday, January 1, 2017 | 3377439000 | 3276296000 |
| Monday, January 1, 2018 | 3299635000 | 3426401000 |
| Tuesday, January 1, 2019 | 3259091000 | 3613406000 |
| Wednesday, January 1, 2020 | 3217133000 | 3832107000 |
| Friday, January 1, 2021 | 3287413000 | 4612647000 |
| Saturday, January 1, 2022 | 4805277000 | 5244055000 |
| Sunday, January 1, 2023 | 3237016000 | 5291627000 |
| Monday, January 1, 2024 | 5573604000 |
Infusing magic into the data realm
In the ever-evolving landscape of global business, understanding the cost of revenue is crucial for investors and analysts alike. This metric, which represents the direct costs attributable to the production of goods sold by a company, offers insights into operational efficiency and profitability.
From 2014 to 2023, Watsco, Inc. and AerCap Holdings N.V. have shown distinct trajectories in their cost of revenue. Watsco, Inc., a leader in HVAC distribution, has seen a steady increase, peaking in 2023 with a 77% rise from its 2014 figures. In contrast, AerCap Holdings N.V., a titan in aircraft leasing, experienced a more volatile path, with a notable spike in 2022, marking a 113% increase from 2014, before a slight dip in 2023.
These trends reflect broader industry dynamics, with Watsco benefiting from consistent demand in the HVAC sector, while AerCap navigates the complexities of the aviation market. Understanding these patterns not only aids in investment decisions but also provides a window into the economic forces shaping these industries.
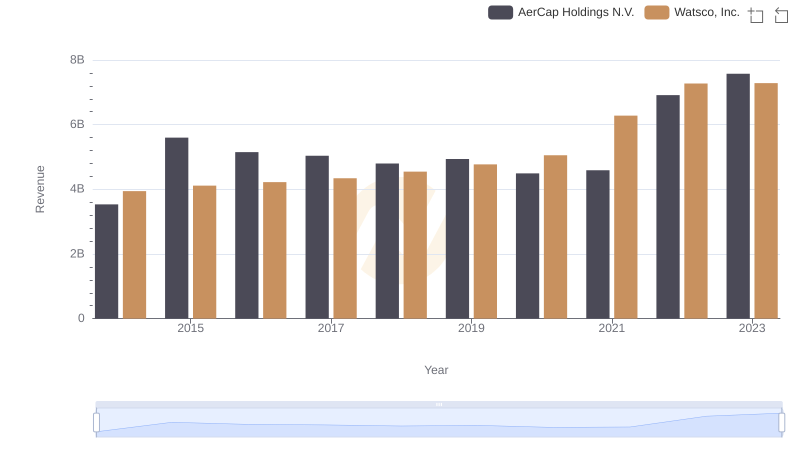
Watsco, Inc. vs AerCap Holdings N.V.: Examining Key Revenue Metrics
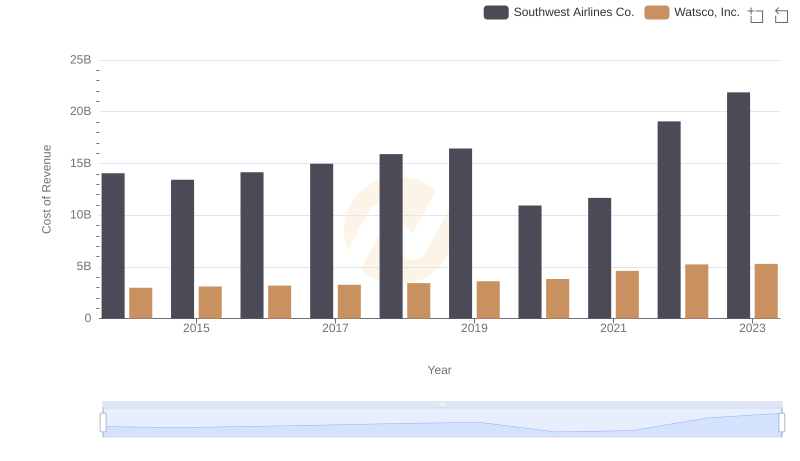
Analyzing Cost of Revenue: Watsco, Inc. and Southwest Airlines Co.
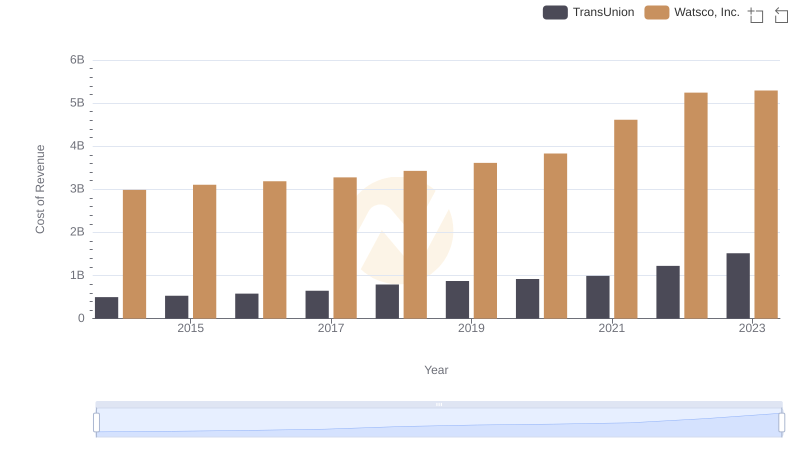
Cost Insights: Breaking Down Watsco, Inc. and TransUnion's Expenses
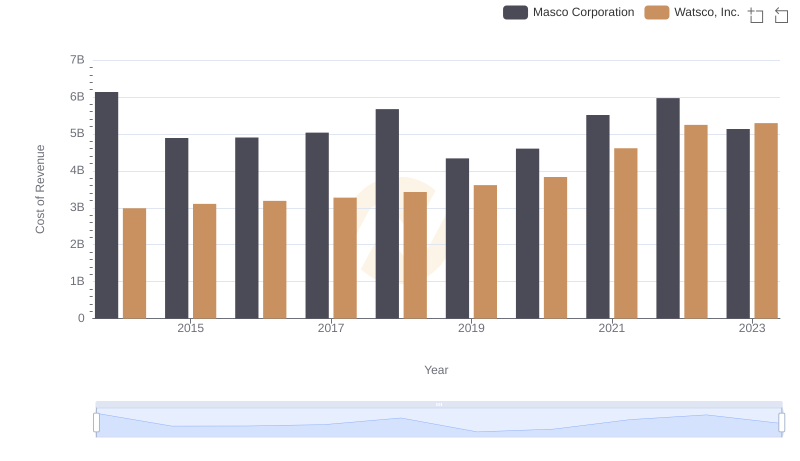
Watsco, Inc. vs Masco Corporation: Efficiency in Cost of Revenue Explored
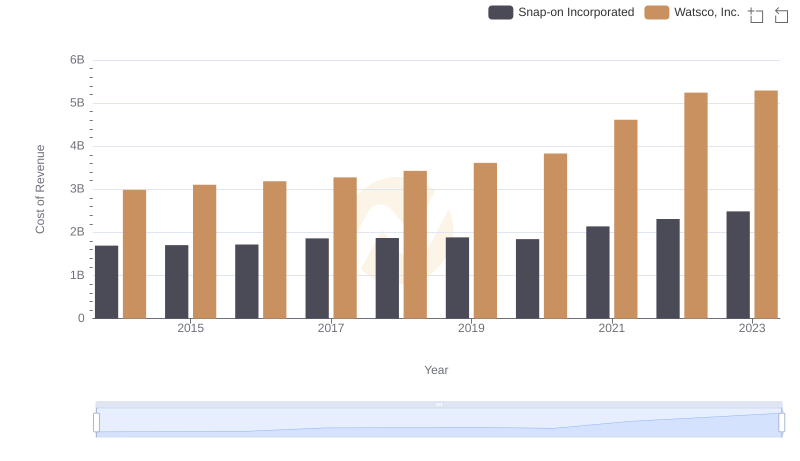
Cost Insights: Breaking Down Watsco, Inc. and Snap-on Incorporated's Expenses
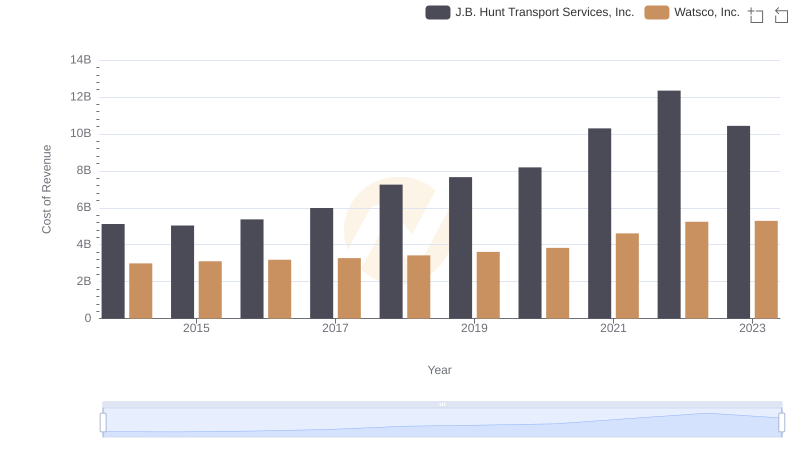
Cost Insights: Breaking Down Watsco, Inc. and J.B. Hunt Transport Services, Inc.'s Expenses
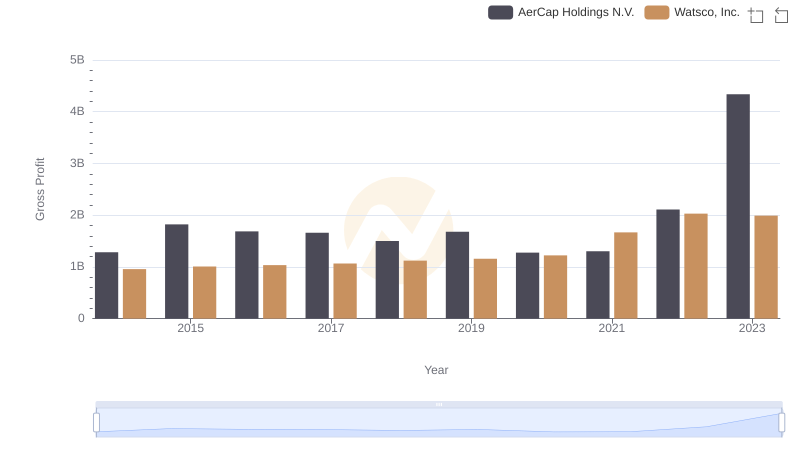
Gross Profit Comparison: Watsco, Inc. and AerCap Holdings N.V. Trends
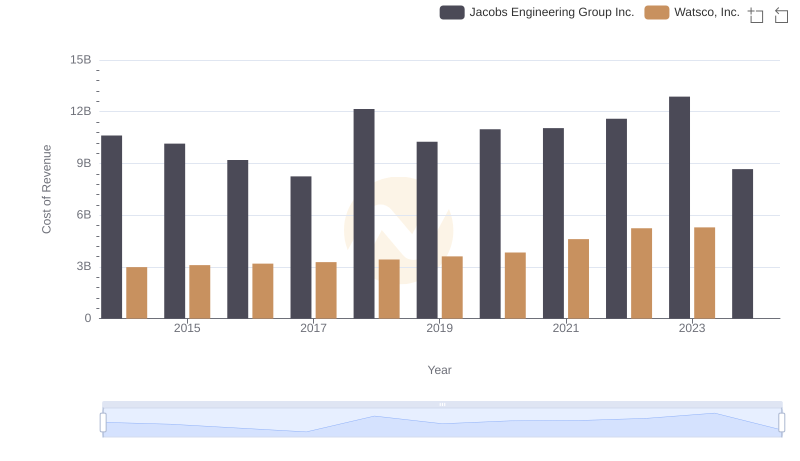
Cost of Revenue: Key Insights for Watsco, Inc. and Jacobs Engineering Group Inc.
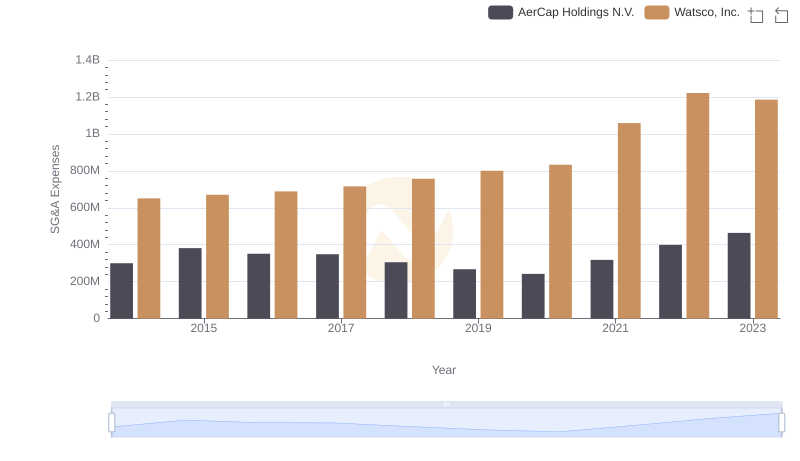
Breaking Down SG&A Expenses: Watsco, Inc. vs AerCap Holdings N.V.