| __timestamp | Waste Management, Inc. | XPO Logistics, Inc. |
|---|---|---|
| Wednesday, January 1, 2014 | 1481000000 | 422500000 |
| Thursday, January 1, 2015 | 1343000000 | 1113400000 |
| Friday, January 1, 2016 | 1410000000 | 1651200000 |
| Sunday, January 1, 2017 | 1468000000 | 1656500000 |
| Monday, January 1, 2018 | 1453000000 | 1837000000 |
| Tuesday, January 1, 2019 | 1631000000 | 1845000000 |
| Wednesday, January 1, 2020 | 1728000000 | 2172000000 |
| Friday, January 1, 2021 | 1864000000 | 1322000000 |
| Saturday, January 1, 2022 | 1938000000 | 678000000 |
| Sunday, January 1, 2023 | 1926000000 | 167000000 |
| Monday, January 1, 2024 | 2264000000 | 134000000 |
Unleashing the power of data
In the ever-evolving landscape of corporate finance, understanding the trends in Selling, General, and Administrative (SG&A) expenses is crucial for investors and analysts alike. Over the past decade, Waste Management, Inc. and XPO Logistics, Inc. have showcased contrasting trajectories in their SG&A expenses.
From 2014 to 2023, Waste Management, Inc. has seen a steady increase in its SG&A expenses, peaking in 2022 with a 31% rise from 2014. In contrast, XPO Logistics, Inc. experienced a dramatic fluctuation, with expenses soaring by over 400% from 2014 to 2020, before plummeting by 92% in 2023.
These trends reflect broader strategic shifts within each company, with Waste Management focusing on consistent growth and XPO Logistics undergoing significant restructuring. Investors should consider these patterns when evaluating the financial health and strategic direction of these industry giants.
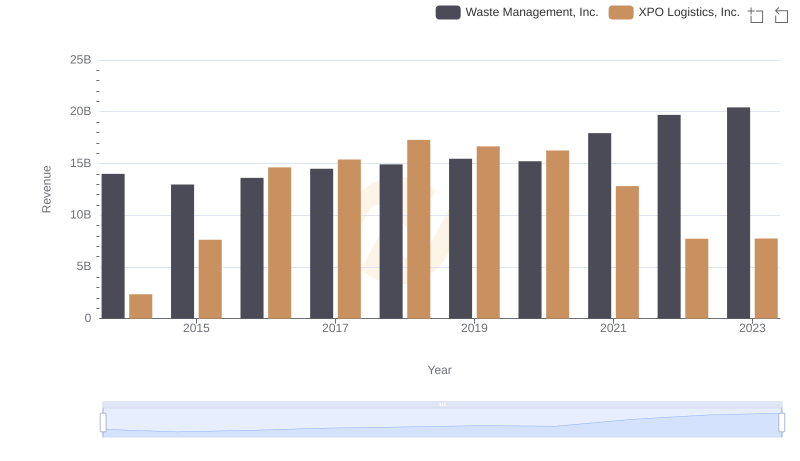
Waste Management, Inc. vs XPO Logistics, Inc.: Annual Revenue Growth Compared
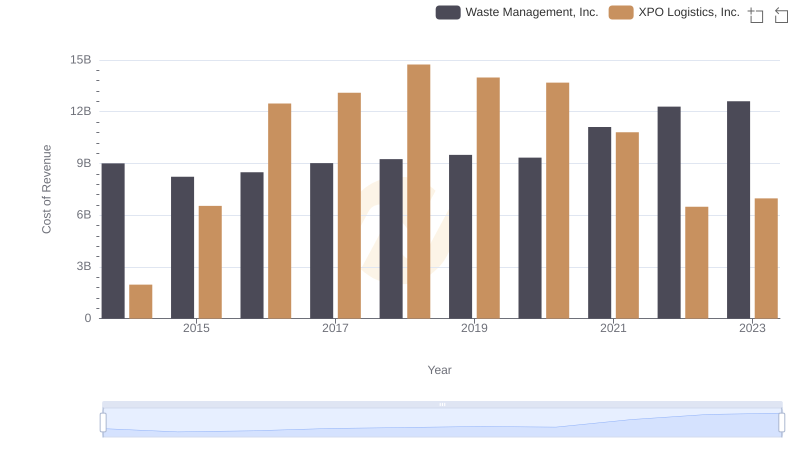
Cost of Revenue: Key Insights for Waste Management, Inc. and XPO Logistics, Inc.
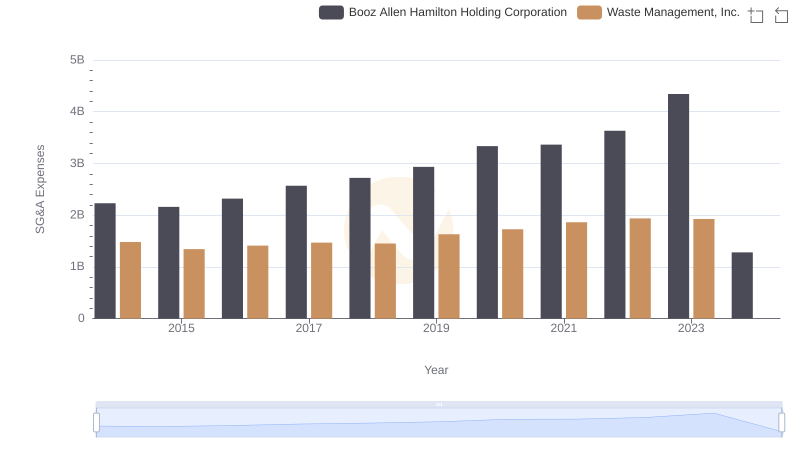
SG&A Efficiency Analysis: Comparing Waste Management, Inc. and Booz Allen Hamilton Holding Corporation
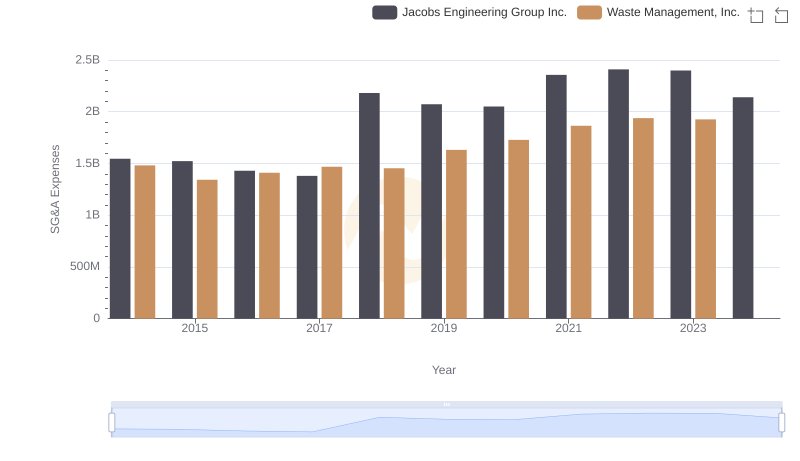
Cost Management Insights: SG&A Expenses for Waste Management, Inc. and Jacobs Engineering Group Inc.
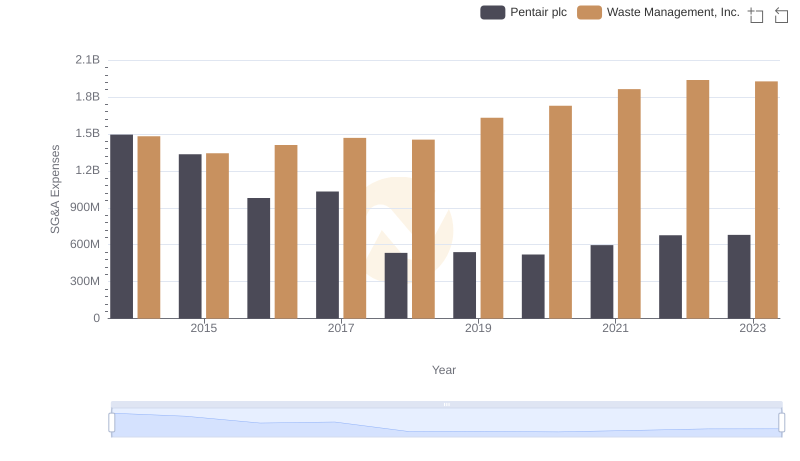
SG&A Efficiency Analysis: Comparing Waste Management, Inc. and Pentair plc
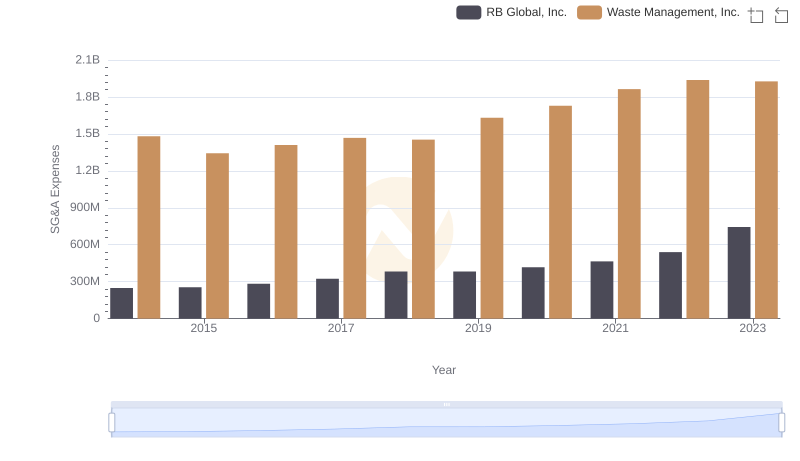
Cost Management Insights: SG&A Expenses for Waste Management, Inc. and RB Global, Inc.
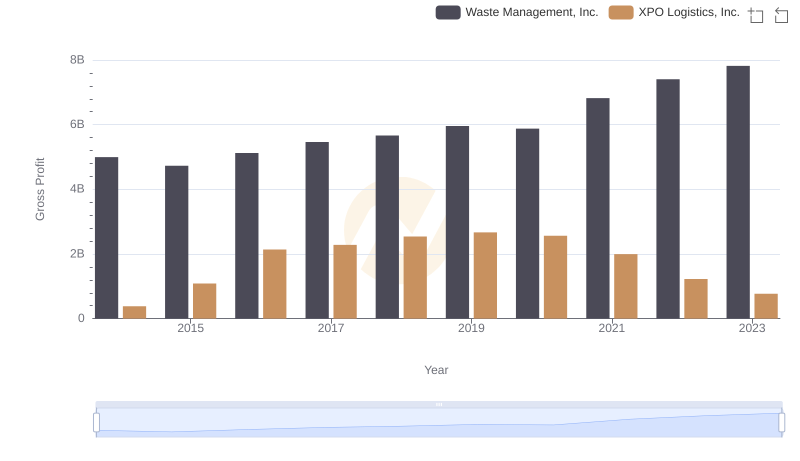
Gross Profit Analysis: Comparing Waste Management, Inc. and XPO Logistics, Inc.
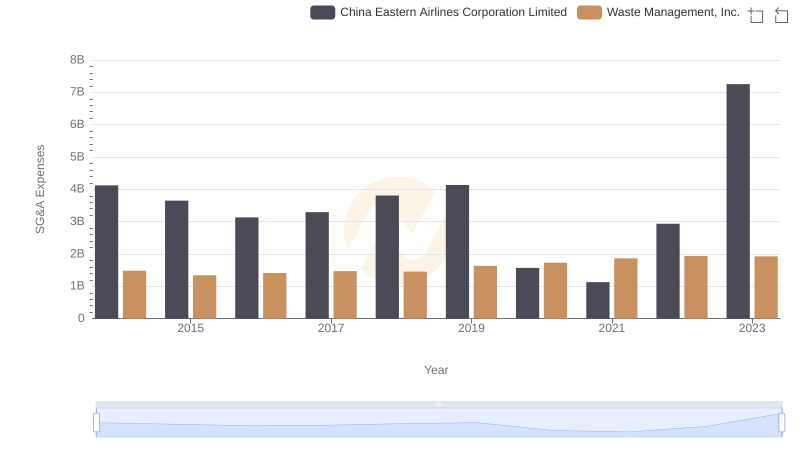
Selling, General, and Administrative Costs: Waste Management, Inc. vs China Eastern Airlines Corporation Limited
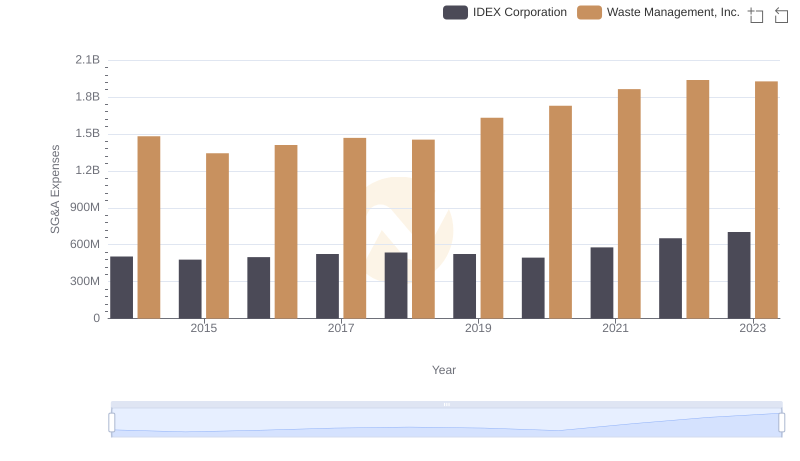
Waste Management, Inc. vs IDEX Corporation: SG&A Expense Trends
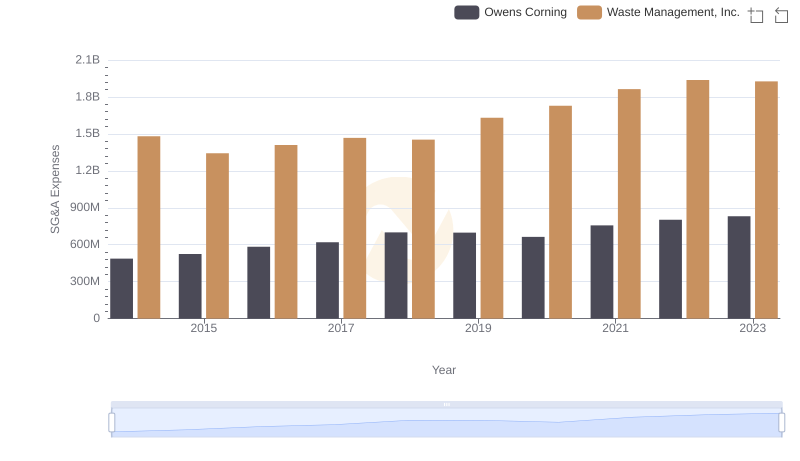
Selling, General, and Administrative Costs: Waste Management, Inc. vs Owens Corning
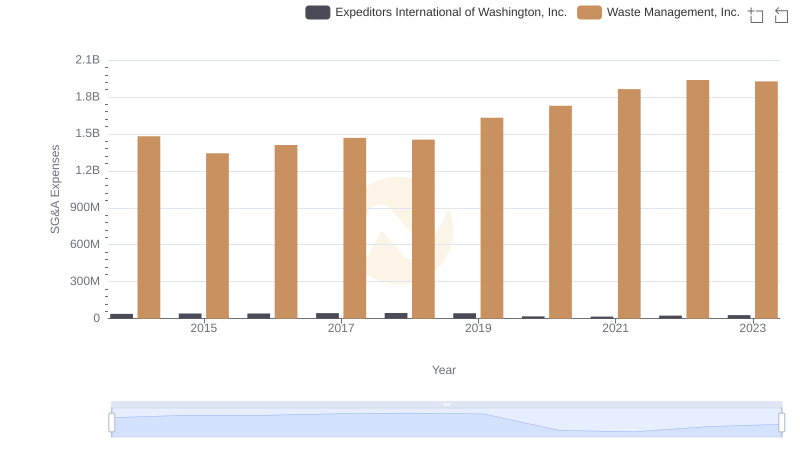
Comparing SG&A Expenses: Waste Management, Inc. vs Expeditors International of Washington, Inc. Trends and Insights
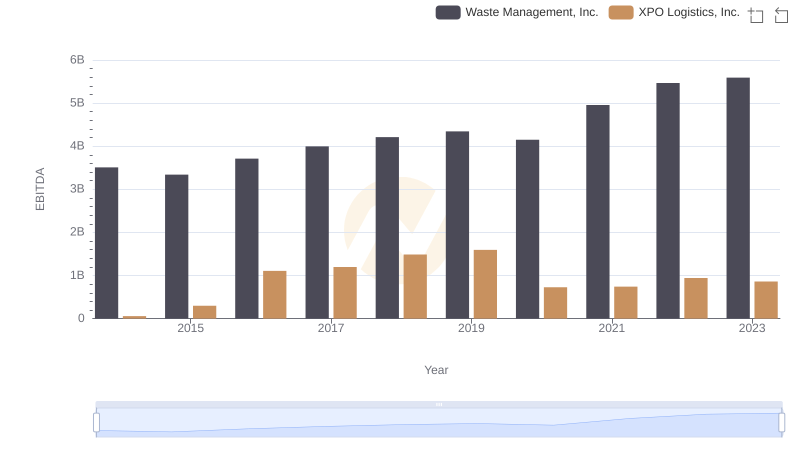
EBITDA Analysis: Evaluating Waste Management, Inc. Against XPO Logistics, Inc.