| __timestamp | Waste Management, Inc. | XPO Logistics, Inc. |
|---|---|---|
| Wednesday, January 1, 2014 | 9002000000 | 1975000000 |
| Thursday, January 1, 2015 | 8231000000 | 6538400000 |
| Friday, January 1, 2016 | 8486000000 | 12480100000 |
| Sunday, January 1, 2017 | 9021000000 | 13101100000 |
| Monday, January 1, 2018 | 9249000000 | 14738000000 |
| Tuesday, January 1, 2019 | 9496000000 | 13982000000 |
| Wednesday, January 1, 2020 | 9341000000 | 13689000000 |
| Friday, January 1, 2021 | 11111000000 | 10812000000 |
| Saturday, January 1, 2022 | 12294000000 | 6491000000 |
| Sunday, January 1, 2023 | 12606000000 | 6974000000 |
| Monday, January 1, 2024 | 13383000000 | 7157000000 |
Unlocking the unknown
In the ever-evolving landscape of logistics and waste management, understanding cost structures is crucial. Waste Management, Inc. and XPO Logistics, Inc. have shown distinct trends in their cost of revenue from 2014 to 2023. Waste Management, Inc. has seen a steady increase, peaking at approximately $12.6 billion in 2023, marking a 40% rise from 2014. In contrast, XPO Logistics, Inc. experienced a more volatile trajectory, with costs peaking in 2018 at around $14.7 billion before declining to $6.97 billion in 2023. This represents a significant 53% drop over five years. These trends highlight the differing operational strategies and market conditions faced by these industry giants. As businesses navigate economic shifts, understanding these cost dynamics can provide valuable insights for stakeholders and investors.
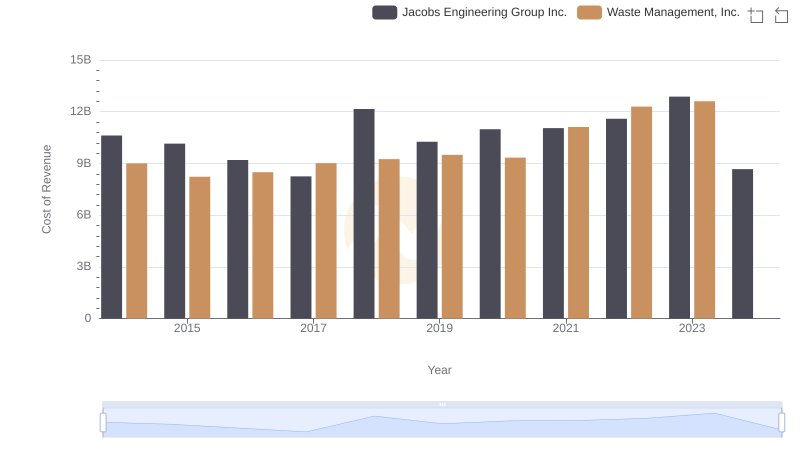
Cost of Revenue: Key Insights for Waste Management, Inc. and Jacobs Engineering Group Inc.
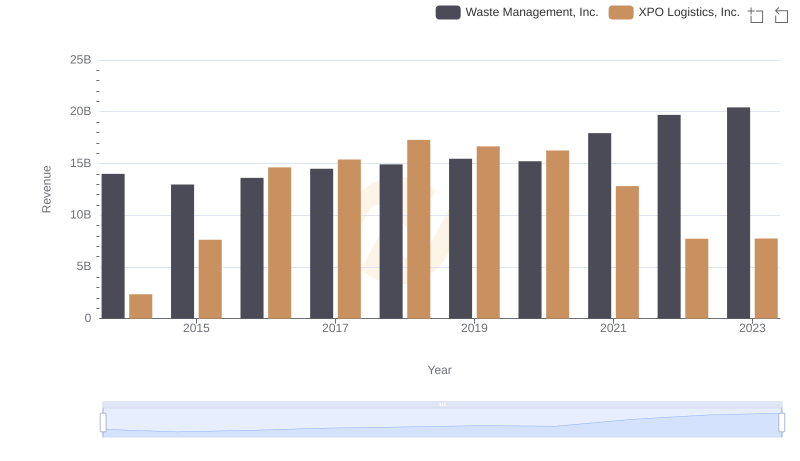
Waste Management, Inc. vs XPO Logistics, Inc.: Annual Revenue Growth Compared
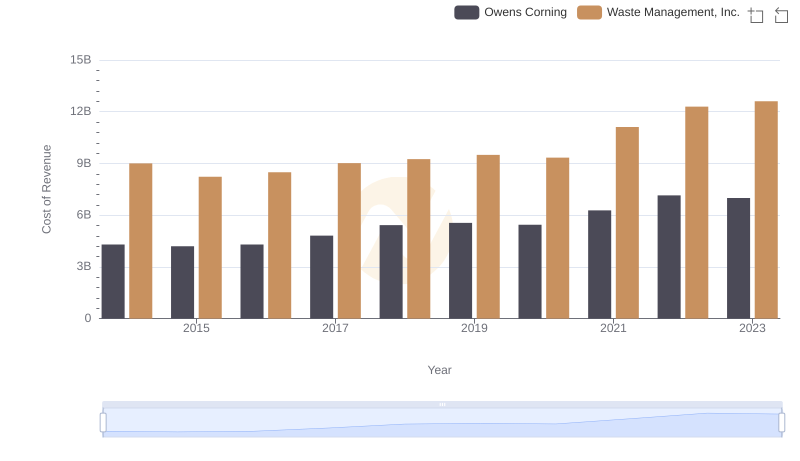
Comparing Cost of Revenue Efficiency: Waste Management, Inc. vs Owens Corning
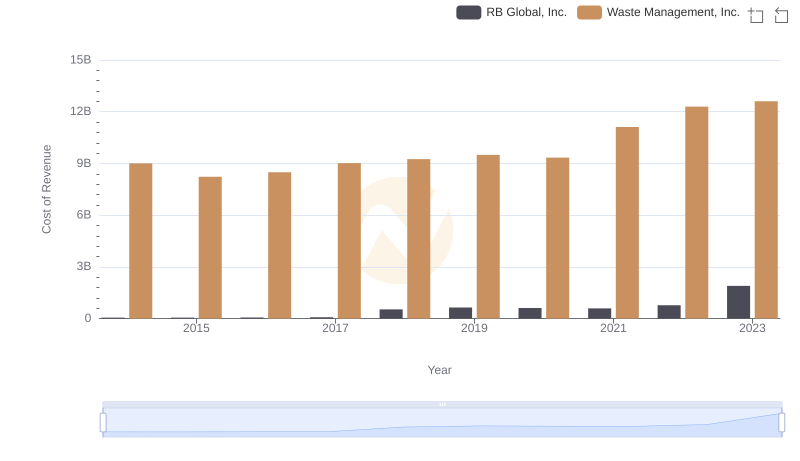
Cost of Revenue: Key Insights for Waste Management, Inc. and RB Global, Inc.
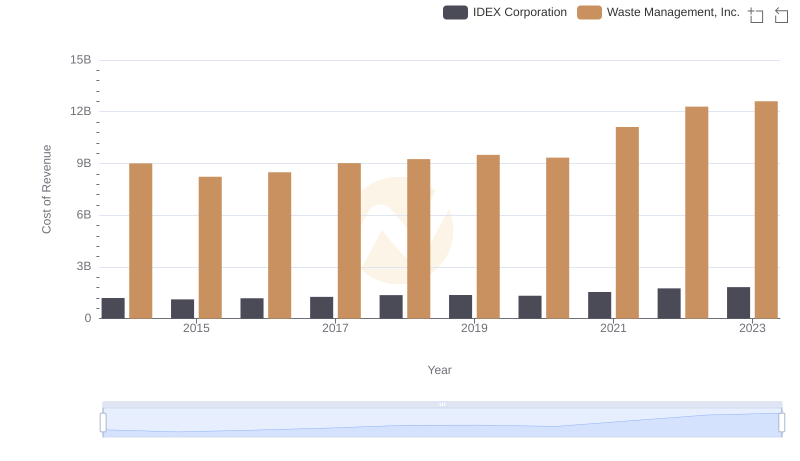
Comparing Cost of Revenue Efficiency: Waste Management, Inc. vs IDEX Corporation
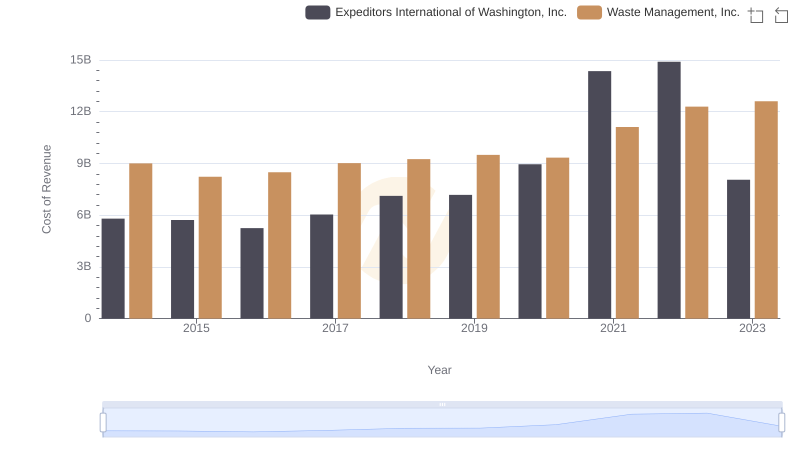
Waste Management, Inc. vs Expeditors International of Washington, Inc.: Efficiency in Cost of Revenue Explored

Cost of Revenue: Key Insights for Waste Management, Inc. and China Eastern Airlines Corporation Limited
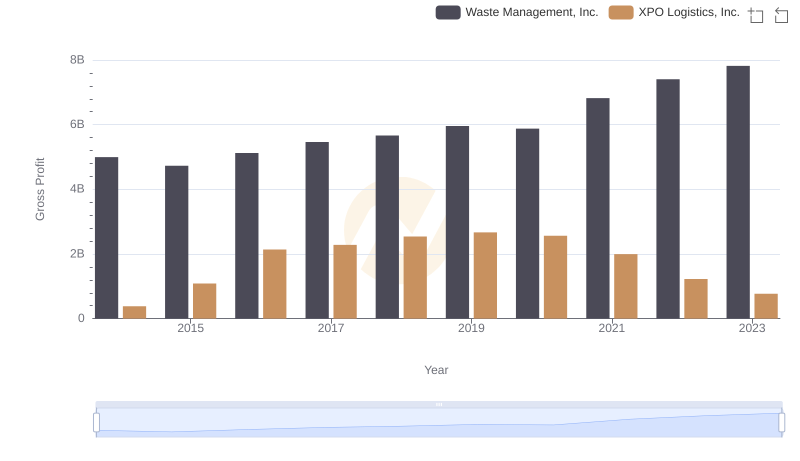
Gross Profit Analysis: Comparing Waste Management, Inc. and XPO Logistics, Inc.
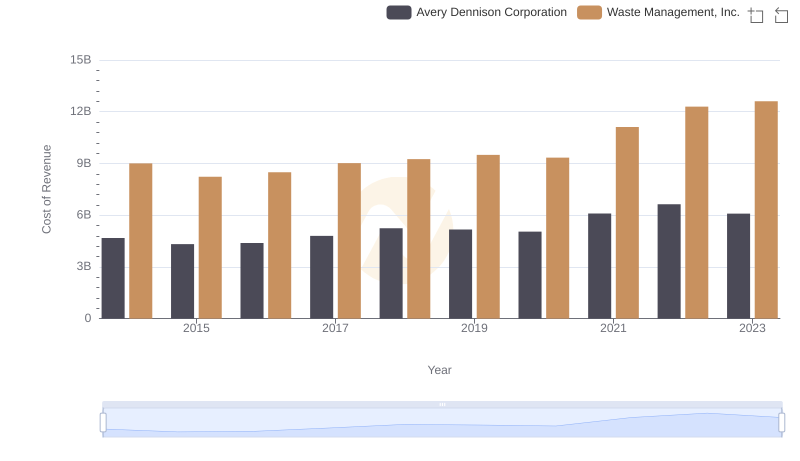
Cost Insights: Breaking Down Waste Management, Inc. and Avery Dennison Corporation's Expenses
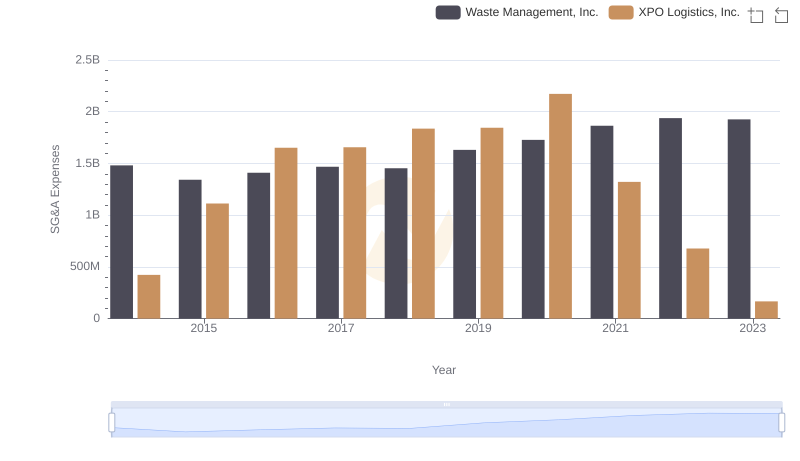
Waste Management, Inc. vs XPO Logistics, Inc.: SG&A Expense Trends
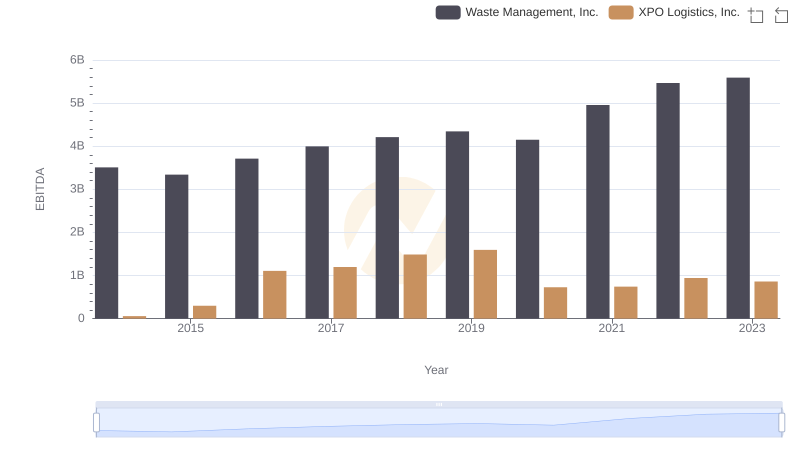
EBITDA Analysis: Evaluating Waste Management, Inc. Against XPO Logistics, Inc.